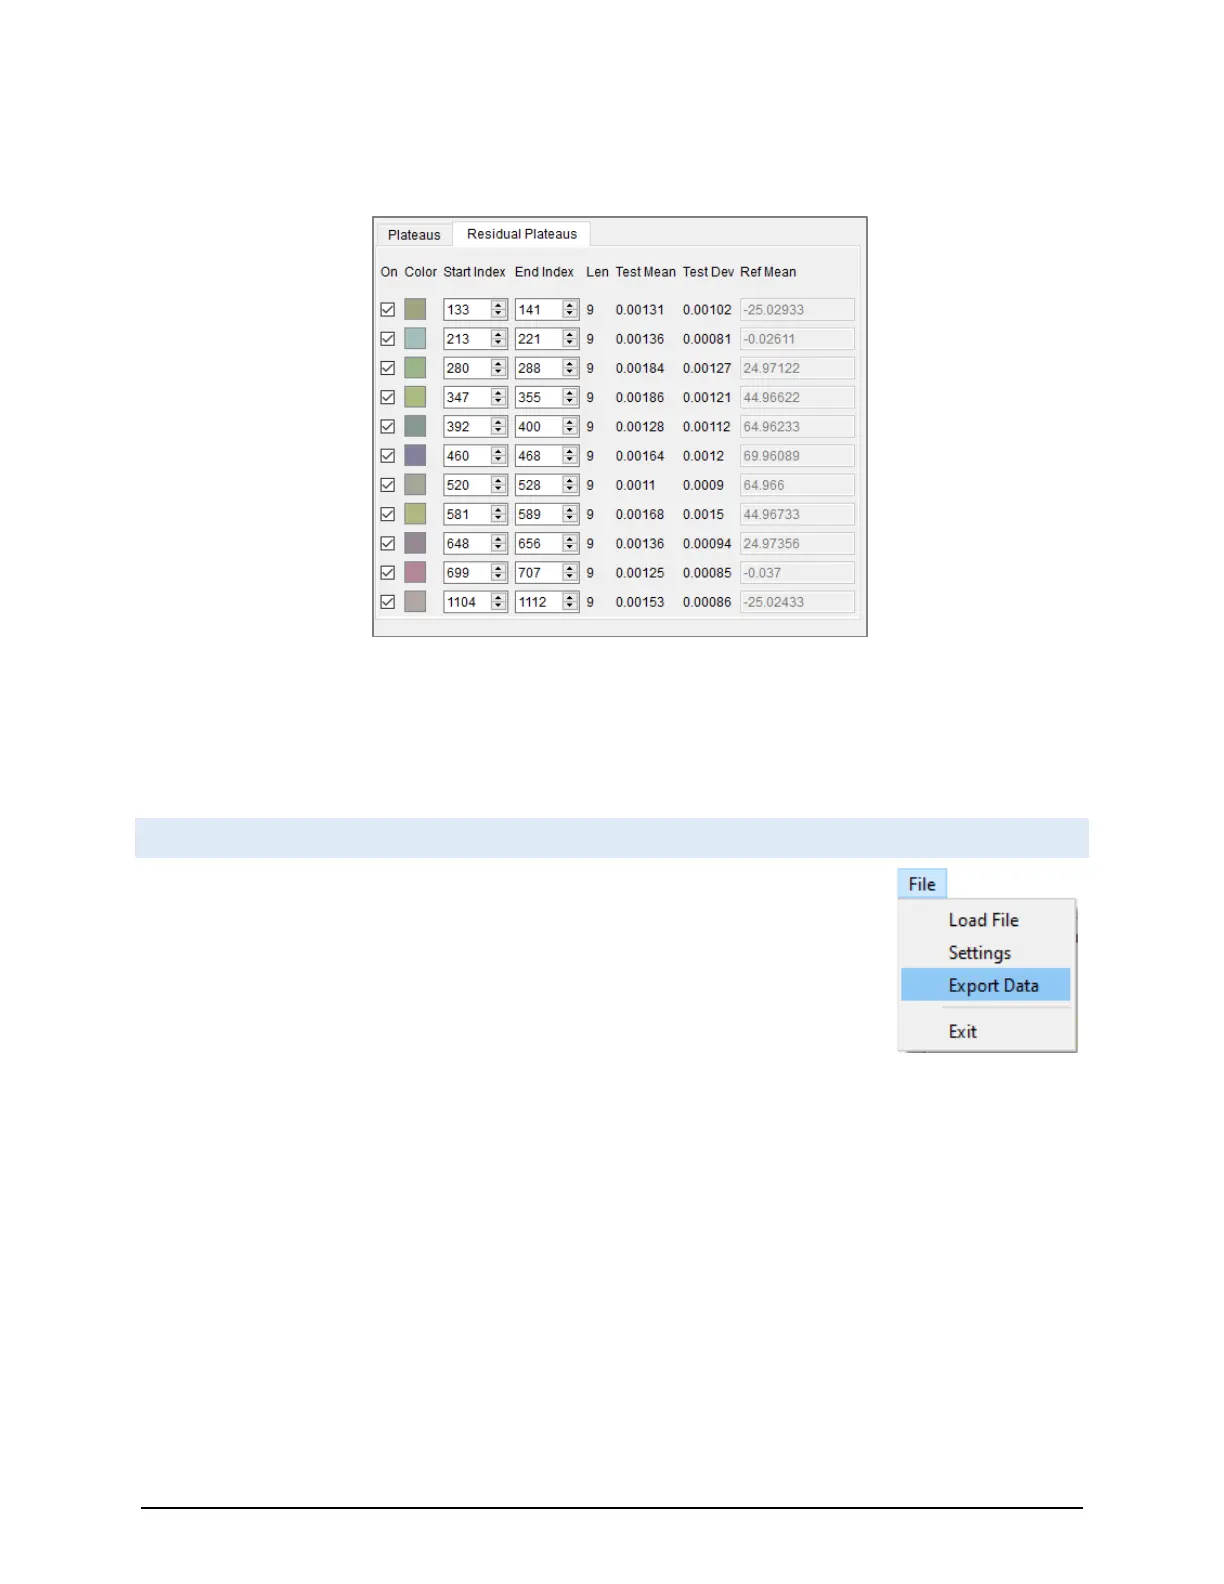
The ‘Residual Plateaus’ tab will also fill with new calculated data relative to the coefficient-applied UUT data, as
shown in Figure 5.38. The new Test Mean should be very close to the Ref Mean, and the Test Dev/Error should be
much smaller values than they are in the ‘Plateaus’ tab.
If the coefficients do not correct the UUT values enough, either the plateaus or the coefficients themselves can be
changed.
10.8 EXPORT DATA
Once the residual data has been plotted, now export the calculated coefficients and the
data from each plateau to a single CSV file. To do so, click the Export Data button that has
now been enabled under File->Export Data. RHS Plateau will ask for a serial number
followed by a file dialog where a location and file name can be specified.
This file contains both the calculated coefficients as well as the data that was used in
those calculations. This file is a useful resource for auditing purposes where validation of
plateau’s curve fit capability is desired.
 Loading...