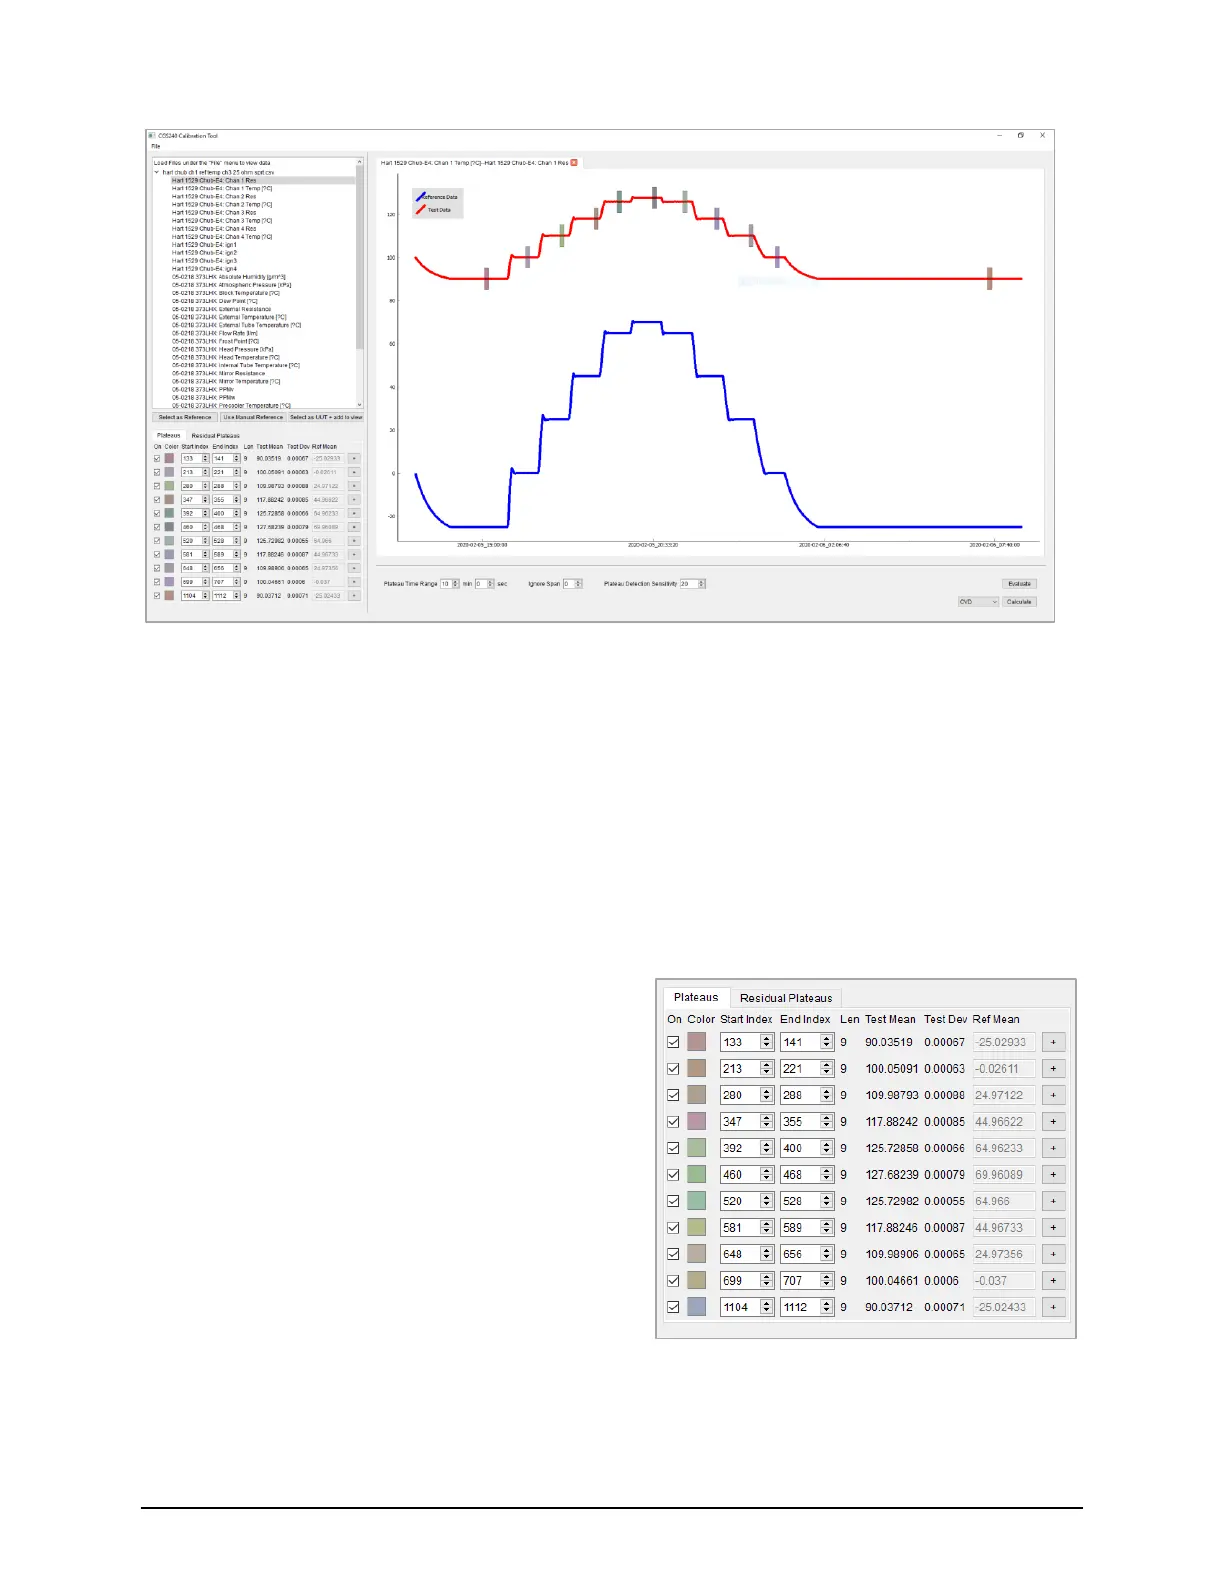
A table with all of the plateau data for this set will also display (see Figure 5.26).
This data includes the following:
• A checkbox labeled On which specifies if the plateau point is used in coefficient calculation.
When Off, the data is not used in coefficient calculation.
• A colored box labeled Color which maps to the color of the plateau box shown on the graph.
• A spinbox labeled Start Index which represents the beginning index of the plateau in the original data set,
starting from 0. This can also be altered in real time to a different value by clicking in to the spinbox and
typing a new value.
• A spinbox labeled End Index which represents the
end index of the plateau in the original data set,
starting from 0. This can also be altered in real time
to a different value by clicking in to the spinbox and
typing a new value.
• A number labeled Len which is the number of data
points within a plateau.
• A number labeled Test Mean which is the mean of
all the values within the plateau data set.
• A number labeled Test Dev which is the standard
deviation of all the values within the plateau data
set.
• An input box labeled Ref Mean which contains the
mean value of the reference data set over the
specified plateau indices.
 Loading...