34 © Scania Industrial & Marine Engines 2003-10:1
A
A= Area to be avoided. Only for calculating glycol mix.
Coolant freezing temperature when ice starts to form at different glycol mixes
% glycol by
volume
15 20 25 30 35 40 45 50 60
Cooling
system
capacity,
dm
3
Ice slush starts
to form at °C
-6 -9 -12 -16 -22 -27 -36 -46 -55
Glycol dm
3
(litres)
5 6 8 9 11 12 14 15 18 30
6 8 10 12 14 16 18 20 24 40
8 10 13 15 18 20 23 25 30 50
9 12 15 18 21 24 27 30 36 60
11 14 18 21 25 28 32 35 42 70
12 16 20 24 28 32 36 40 48 80
14 18 23 27 32 36 41 45 54 90
15 20 25 30 35 40 45 50 60 100
17 22 28 33 39 44 50 55 66 110
18 24 30 36 42 48 54 60 72 120
20 26 33 39 46 52 59 65 78 130
21 28 35 42 49 56 63 70 84 140
23 30 38 45 53 60 68 75 90 150
24 32 40 48 56 64 72 80 96 160
26 34 43 51 60 68 77 85 102 170
27 36 45 54 63 72 81 90 108 180
29 38 48 57 67 76 86 95 114 190
30 40 50 60 70 80 90 100 120 200
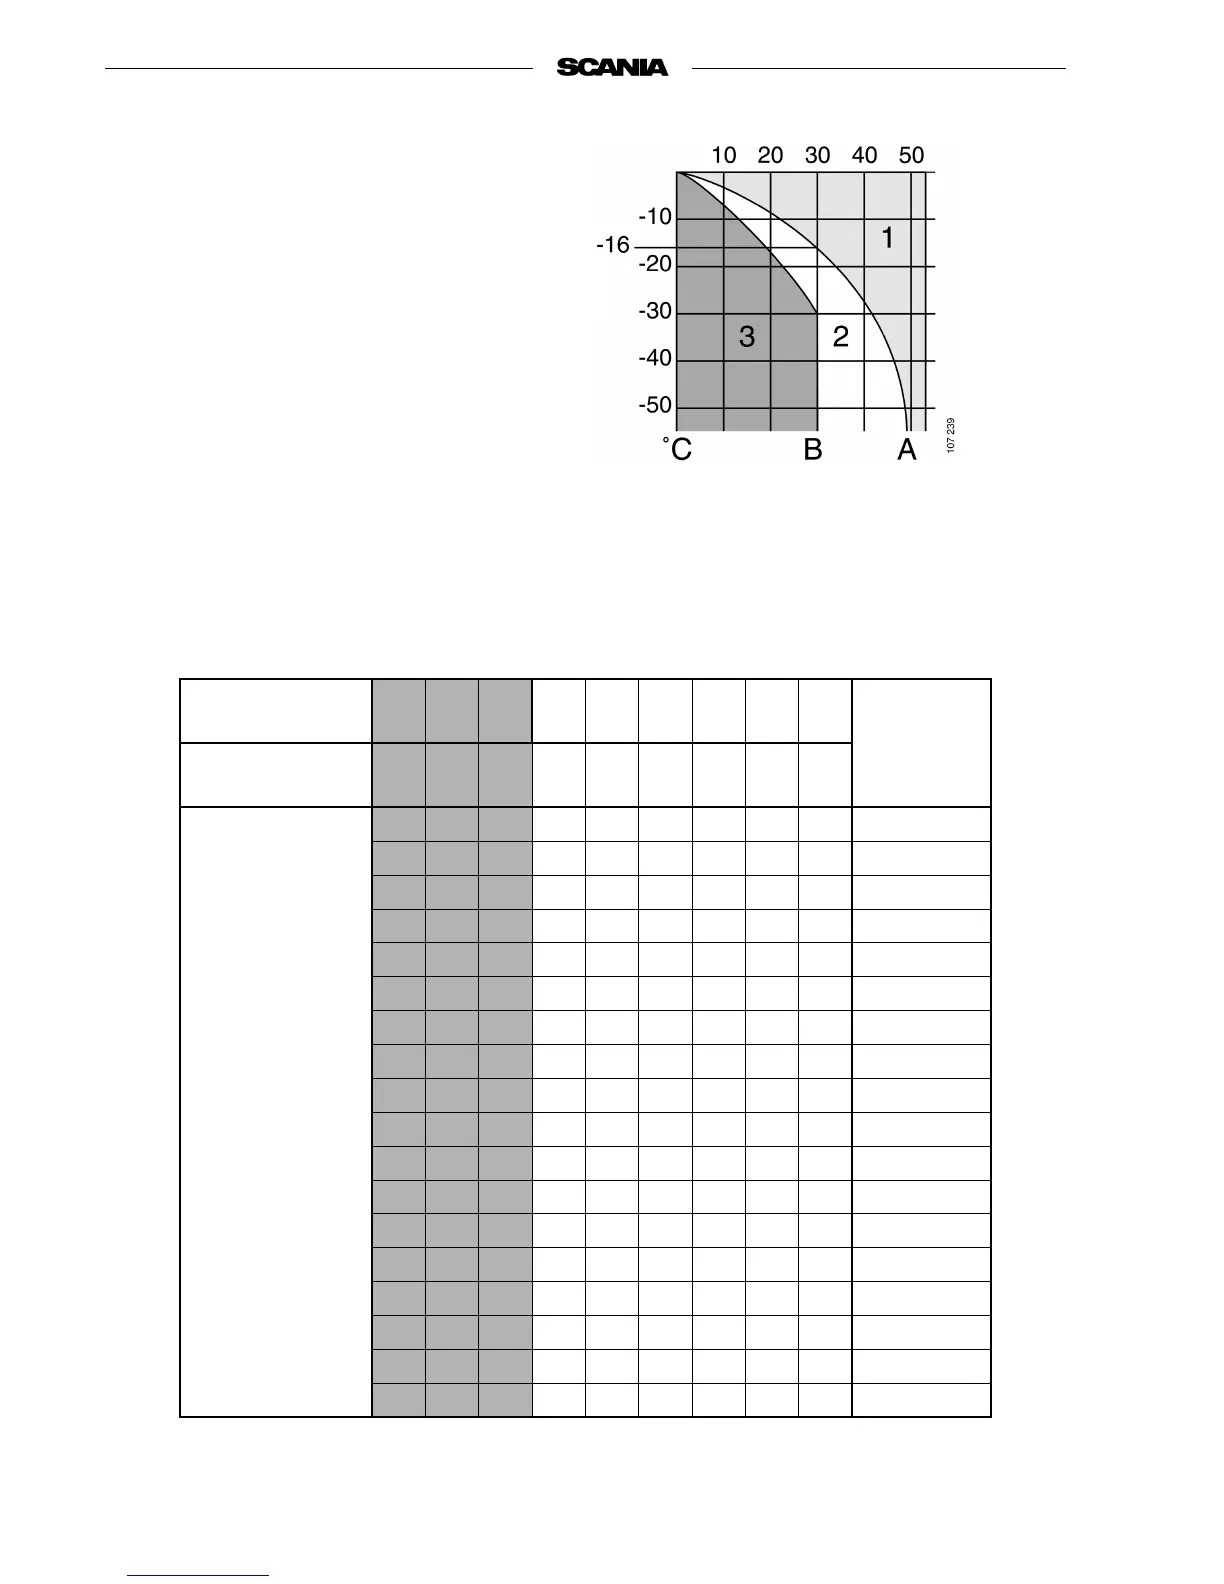
Curve A: Ice formation starts (ice slush)
Curve B: Temperature at which there is a risk of
damage by freezing
1. Safe area
2. Malfunctions may occur (ice slush)
Characteristics of glycol at low
temperatures:
- Example with 30% glycol by volume
- Ice slush starts to form at -16°C
- There is risk for malfunctions at -30°C
- No risk of damage by freezing with a
minimum content of 30% glycol by volume
Anti-freeze glycol, % by volume