68
BA 68
Schaeffler Technologies
Schaeffler OPTIME
Using the dashboard levels
Various dashboard levels are accessible via the structure tree on
the [
Resource Browser
] page:
■
level [
Process Area
]
■
level [
Department
]
■
level [
Group
]
■
level [
Machine
]
■
level [
Sensor
].
Alternatively, the individual dashboard levels can also be accessed
via the tab of the same name.
Level
[
Process Area
]
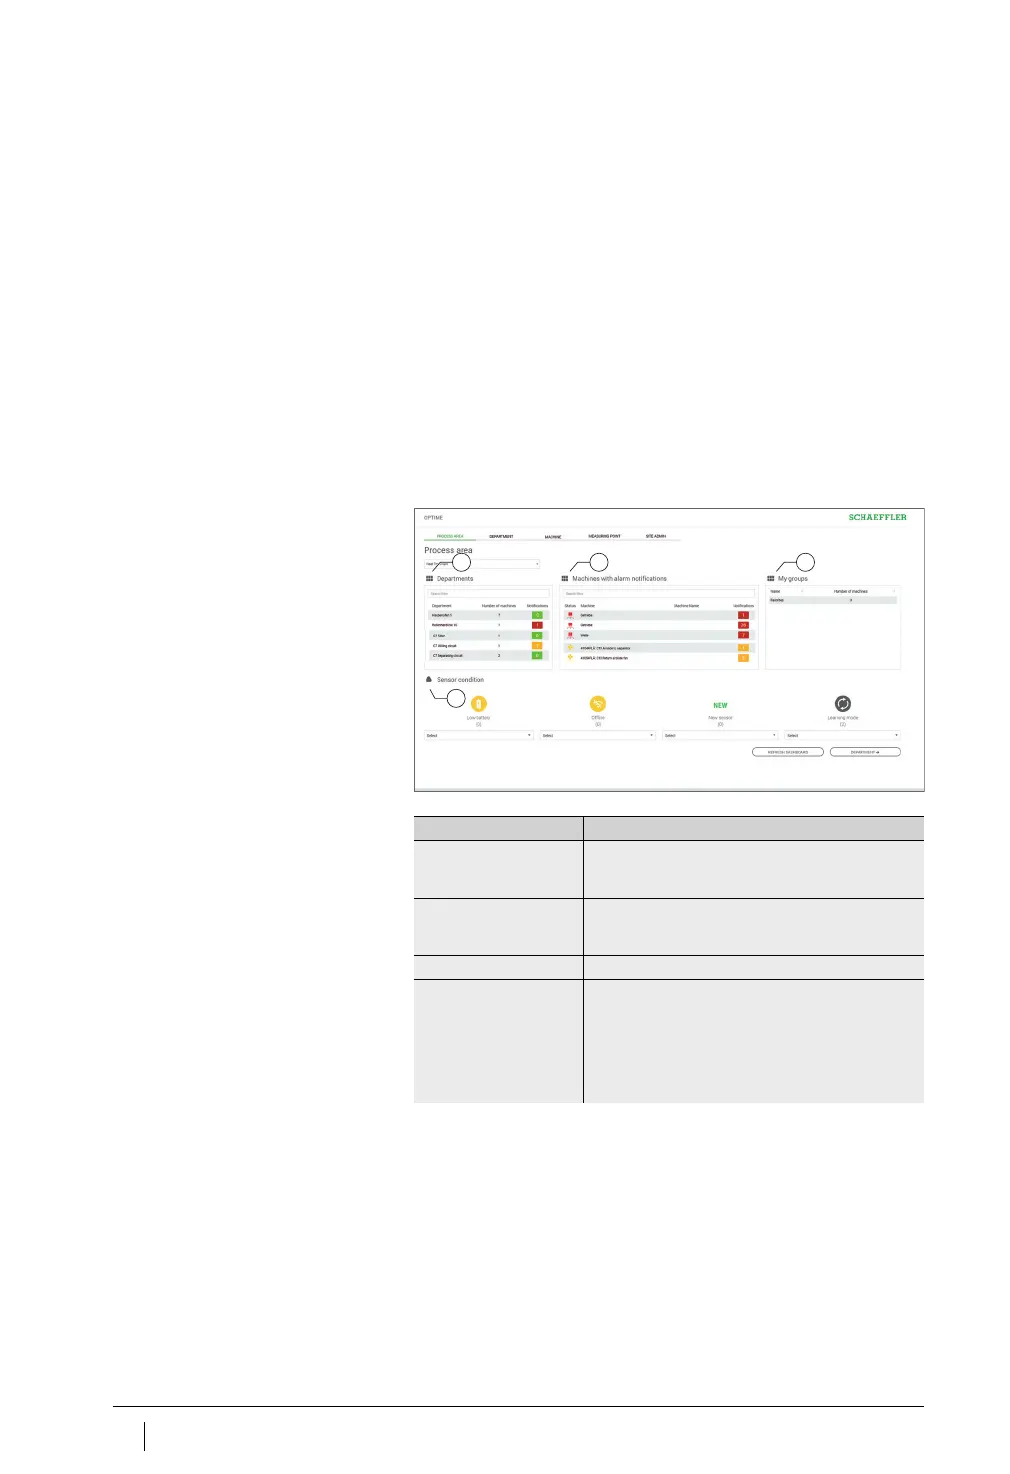
The process area assigned to the user is visible in the [
Process Area
]
level. The page is subdivided into departments, alarm notifications
and user-defined groups. An overview of the sensor conditions is
provided at the bottom of the page.
Explanations
[
Departments
]
[
Machines with alarm notifications
]
[
My groups
]
[
Sensor condition
]
Figure 46
Level [
Process Area
]
Designation Description
[
Departments
] Displays a list of alarm notifications for departments
with the number of alarms and colour-coded
representation of the warning level.
[
Machines with alarm
notifications
]
Displays a list of alarm notifications for machines
with the number of alarms and colour-coded
representation of the warning level.
[
My groups
] Displays user-defined groups.
[
Sensor condition
] Displays lists of the sensors that have one of
the following conditions:
■
low battery level
■
no connection
■
new sensor
■
learning mode.