98
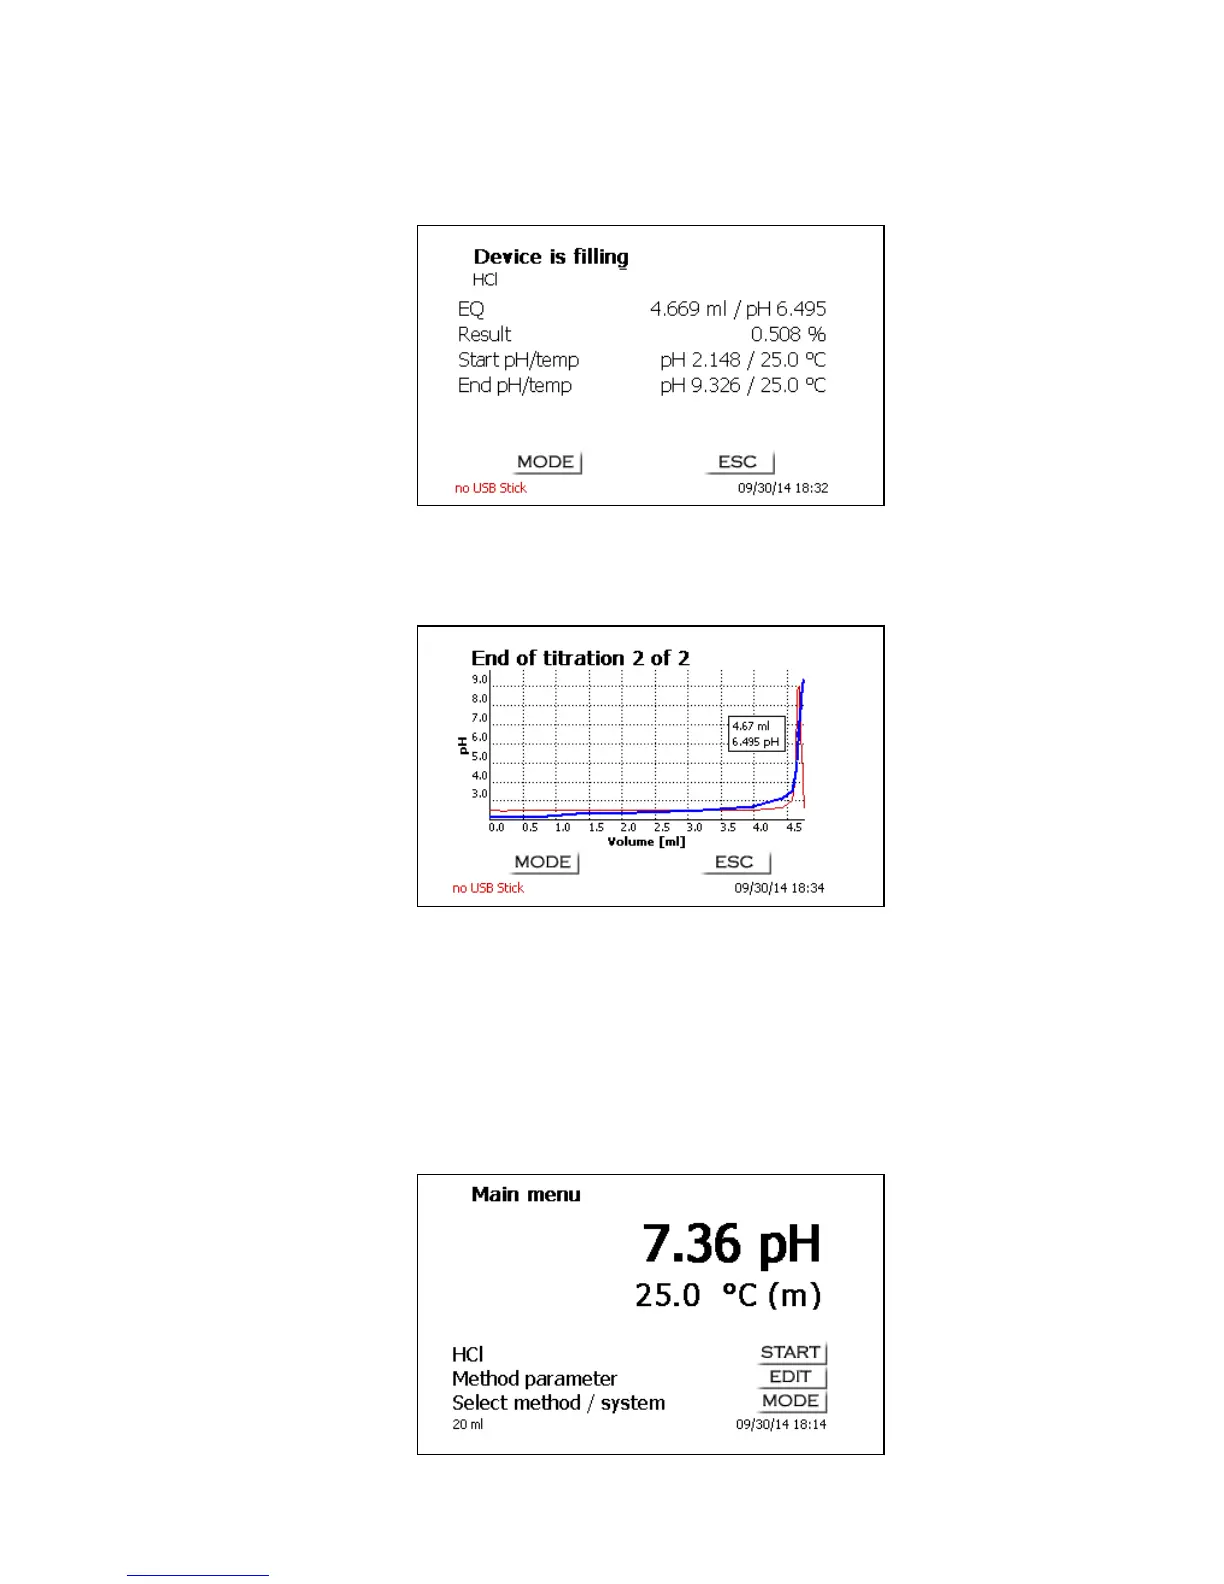
The consumption in ml will be displayed on the X axis, the Y axis will show the measurement reading.
Scaling of the chart will be done automatically. The result will be displayed at the end of the titration
(Fig. 30).
Fig. 30
<MODE>/<F6> can be used to view the titration curve or further resuts. pH und mV titration curves will
show the measurement curve (blue) and the 1
st
derivation (red). The values and the location of the
equivalence point are identified directly in the curve itself.
Fig. 31
If a printer is connected, the results will either be printed according to the settings made for the
method, or else they will be memorised in the form of a PDF- and CSV-file file on a connected USB
stick. If no printer or USB stick is connected, the bottom left corner of the display will show the
message “no printer“ or “no USB stick”.<ESC> will take you back to the main menu where you can
start the next titration immediately.
3.6.2 Calibration (CAL menu)
If you are on the main menu (Fig. 32), calibration is started by pressing the <CAL> key on the titrator
or the <F8/CAL> key from an external keyboard.
Fig. 32