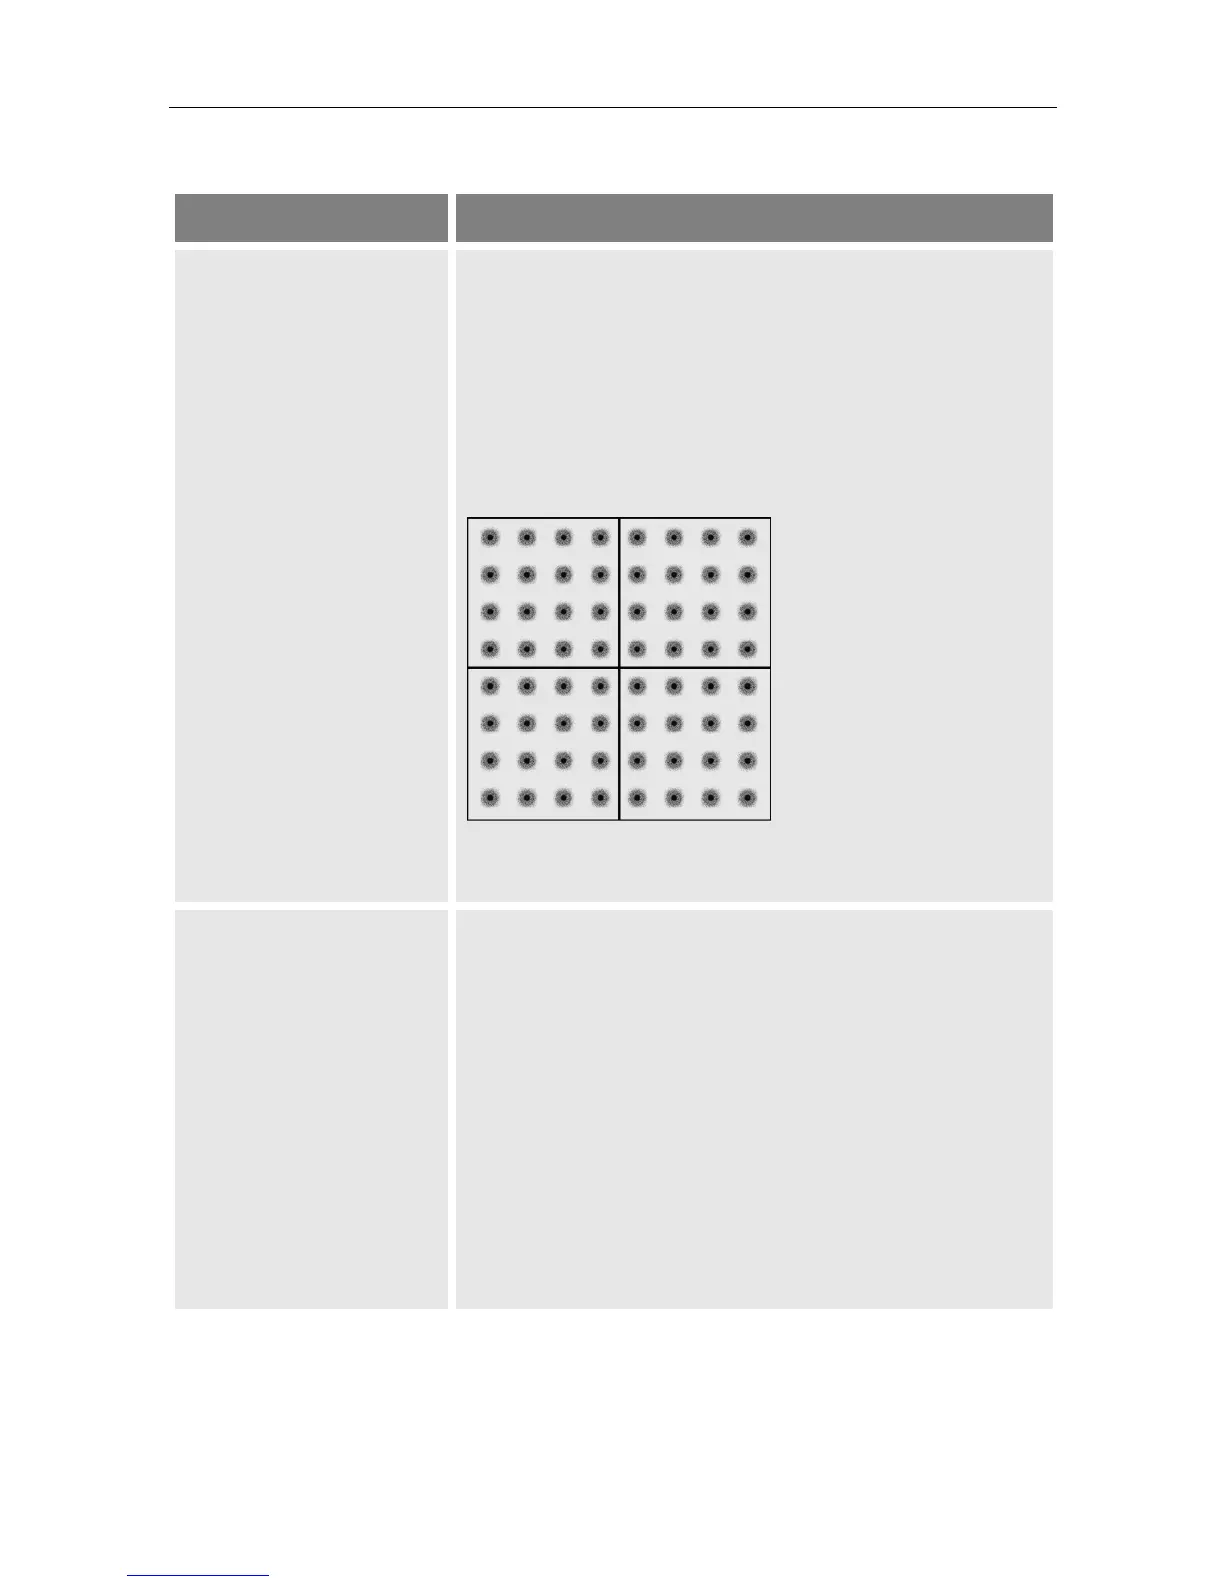
Constellation diagram On the left side of the screen you see a so-called con-
stellation diagram.
A constellation diagram is the graphic reprenentation
of a digital modulated signal (e.g. Quadrature Ampli-
tude Modulation QAM or Quadrature Phase Shift Key-
ing QPSK).
Example: 64 QAM
The more point-source the dots are, the less noisy is
the signal.
MER Modulation error ratio: all signal disturbances are
summarized to one measurement value. The higher
the MER value, the better is the signal quality.
The MER can be worsened by these issues:
Noise (C/N)
Low frequency hum (50/100 Hz)
Inter modulation errors (distortioned amplifiers)
I/Q modulation errors (phase/amplitude)
Signal overlap (DECT phone)
Standing waves (maladaptation or unfavorably
mounted cables)