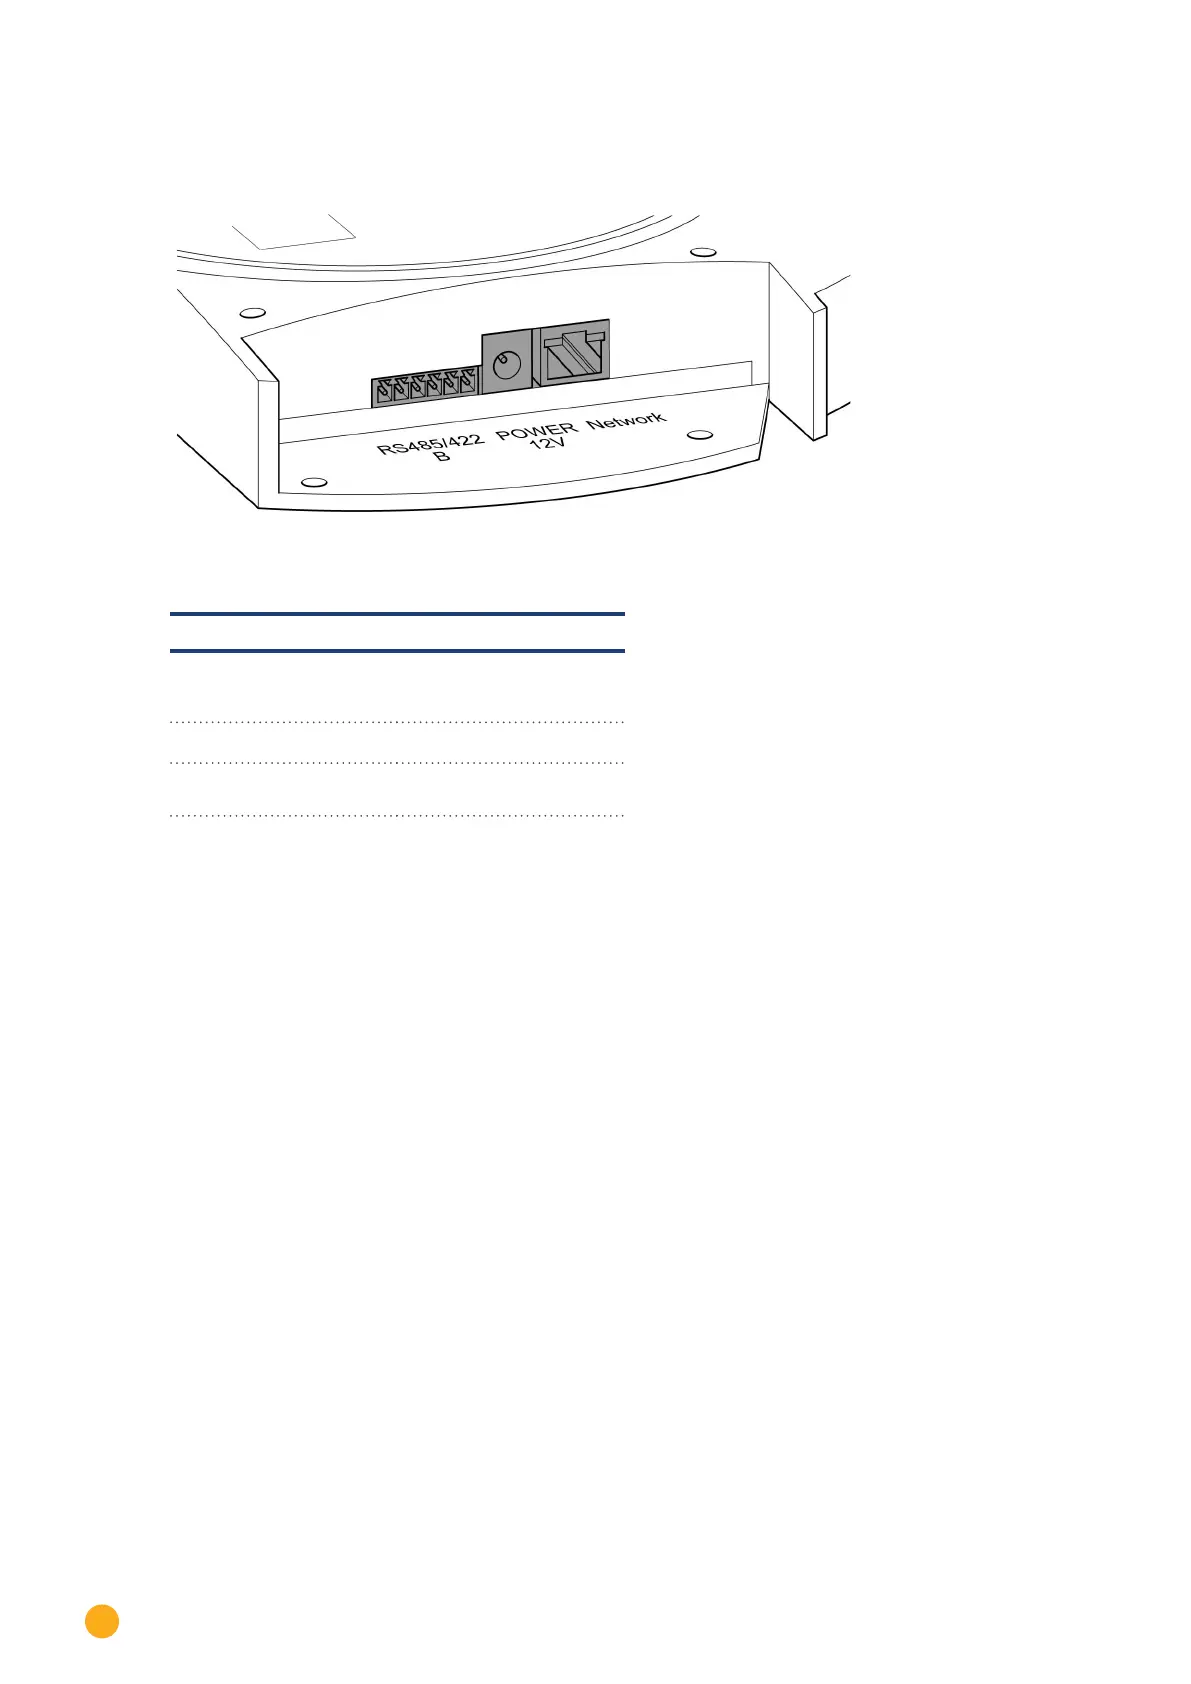
Home
Solar-Log
Measuring Instruments
200
Solar-Log 200 User Manual
5
of 1
of 1 rating
319 pages
Give review
Manual
Specs
To Next Page
To Next Page
To Previous Page
To Previous Page
Loading...
20
Unit connections
Bottom connections
Fig.: Bottom connections Solar-Log 300
Solar-Log 300 / Solar-Log 250
RS485/422 - B
RS485 interface, 6 pin:
Connection for inverters
and additional accessories
Power 12 V
12 volt DC input
Network
Ethernet network interface,
10/100 Mbit
19
21
Table of Contents
Table of Contents
3
Introduction
10
Notes for the Firmware Update
11
Updating from Firmware 2.X to 3.X
12
Safety Information
13
Hazard Classes
14
Electric Current
15
Package Contents
16
Wall Mounting
17
Fig.: Solar-Log™ Wall Mounting
17
Unit Connections
19
Solar-Log 300 / Solar-Log 250
19
Fig.: Top Connections Solar-Log 300
19
Fig.: Bottom Connections Solar-Log 300
20
Solar-Log 1200
21
Fig.: Top Connections Solar-Log 1200
21
Fig.: Top Connections Solar-Log 1200
22
Solar-Log 2000
23
Fig.: Top Connections Solar-Log 2000
23
Fig.: Top Connections Solar-Log 2000
24
Optional Connections
25
Solar-Log™ GPRS
25
Fig.: Insertion Slot for SIM Card Inside on the Right (Solar-Log™ GPRS)
25
Fig.: Antenna Connection on the Top of the Device (Solar-Log™ GPRS)
25
Solar-Log™ Meter (Solar-Log 300 and 1200)
26
Fig.: Connection for Current Transformers (Solar-Log™ Meter)
26
Fig.: Two 6-Pin Terminal Block Connectors for the Meter Interface
27
Solar-Log™ PM
29
Fig.: 6-Pin PM+ Interface
29
Connector Assignments and Wiring
30
Notes on Wiring the Connections
30
Fig.: Example Wiring on a 4-Pin Terminal Block Connector
30
RS485-A (Only Solar-Log 1000, 1200 and 2000)
31
Fig.: Terminal Block Connector with Ferrules
31
Fig.: 4-Pin Terminal Block Connector
31
Rs485/422 - B
32
Fig.: 6-Pin Terminal Block Connector
32
RS485/422 - C (Only Solar-Log 2000)
33
Fig.: 6-Pin Terminal Block Connector
33
S0 out / in a (S0-OUT and S0-IN A)
34
Fig.: Schematic Diagram of the S0 Output
34
S0-In B
35
Fig.: 4-Pin Terminal Block Connector
36
Fig.: 6-Pin PM+ Interface
36
Fig.: 6-Pin Terminal Block Connector
36
Connecting the Inverters
37
Switch off the Inverters and the Solar-Log
38
Connecting Accessories
39
Sensor Box Basic and Professional
39
Sensor Box Professional Plus
41
Fig.: Mounting Information for the Sensor Box Professional Plus
41
Fig.: the Basic Principle of Wiring the PM+ Interface to the Ripple Control Receiver for Active Power Commands
44
Fig.: 6-Pin PM+ Interface
44
Ripple Control Receiver
44
Large External Displays
45
External Power Meter
47
External Power Meters/Accumulating Meters
48
Wiring for S0 Meter
49
Wiring for RS485 Meter
51
Installation Utility Meter / Janitza UMG 104 / UMG 604 (Only Solar-Log 1000 and 2000)
54
Fig.: Example - Utility Meter UMG 104 Connection Diagram for Voltage Measurements in Low-Voltage Power Grids
55
Fig.: Example - Utility Meter UMG 104 Connection Diagram for Current Measurements with Current Transformers
56
Solar-Log™ Smart Relay Box
58
Fig.: Smart Relay Box Relay Output (Change-Over Contact) Diagram
59
Fig.: Smart Relay Box Relay Output (Make Contact) Diagram
59
Wemo Insight Switch
60
Allnet Network Power Socket
61
Connecting the Allnet Network Power Socket to the Solar-Log
62
Other Connections
63
Alarm Contact (Only Solar-Log 1000 and 2000)
63
Fig.: Alarm Contact Connection Diagram
63
Relay (Only Solar-Log 1000, 1200 and 2000)
64
Fig.: Relay Connection Diagram
64
Usb
65
Installation
66
Connecting the Solar-Log™ to a Network / PC
66
Instructions for Connection through the Powerline Package
67
Initial Installation Solar-Log 250 and 300
67
Initial Set up of the Solar-Log 1200
68
Setting up of the Solar-Log™ with the Configuration Wizard
68
Fig.: Startup Screen of the Solar-Log™ Configuration Wizard
69
Fig.: Solar-Log™ Ethernet Settings Via the Solar-Log™ Configuration Wizard
69
Fig.: Example of a Successful Connection Test
69
Fig.: Displayed Firmware Update Window
70
Fig.: Example of an Unsuccessful Connection Test
70
Fig.: Device Detection with Help Text Displayed
71
Fig.: Example - Configuration Wizard - Device Configuration
72
Fig.: Example - Summary of the Configuration Wizard with Deactivated Data Transfers
73
Fig.: Example of the Configuration Wizard Summary
74
Carrying out the Initial Set up of the Solar-Log 250, 300, 1200 and 2000 (Manually)
75
Fig.: Main Menu of the Solar-Log 2000 PM+ GPRS
76
Starting the Configuration
76
Fig.: Solar-Log™ Model Tag
77
Fig.: Pop-Up Window with Security Information
78
Fig.: Configuration Page "Access Control
78
Using the Browser Menu
80
Fig.: Layout of the Main Menu
80
Control Elements
81
Fig.: Control Elements in the Browser Menu
81
Explanations of the Names in the Main Menu
82
Fig.: Log in Button with Selection Box
82
Fig.: Header Bar with the "Hide Arrow
82
Fig.: Signal for New Firmware
82
Fig.: Automatic Firmware Update Check with Notification Text Displayed
83
Fig.: Window Displayed Indicating that a New Firmware Version Is Available
84
Main Menu
85
VLCD Display
85
Fig.: VLCD Display
85
Configuration Menu
86
Configuring Network Settings
86
Ethernet
87
Fig.: Ethernet Settings
87
Fig.: Example of an Unsuccessful Connection Test
88
Fig.: Example of a Successful Connection Test
88
GPRS (Only Solar-Log™ GPRS)
89
Fig.: GPRS Settings
89
General Information about GPRS Devices
92
Wifi (Only Solar-Log Wifi)
93
Fig.: Wifi Settings
93
Proxy
95
Fig.: Proxy Settings
95
Internet Configuration
96
Access Type
96
Portal
96
E-Mail
99
Text Message (SMS)
100
Fig.: Example Configuration STATTLS to Send E-Mail with GMX
100
Export
101
Backup
101
Fig.: Interface Definition Via the Plus Symbol
102
Device Definition
102
Configuring Connected Devices
102
Fig.: Adding Components
103
Fig.: Overview of the Selected Components
104
Fig.: Device Definition for the Solar-Log™ Meter
105
Fig.: Solar-Log™ Meter Operating Mode
107
Device Detection
108
Fig.: Device Detection - Not Started yet
108
Configuring Devices
109
General Information on the Pac Correction Factor
110
Configuring Power Meters
111
Configuring Sensors
112
Fig.: Example of the Module Field Division
116
Fig.: Battery Configuration with Help Text
117
Configuring Plant Data
118
General
118
Plant Groups
119
Graphic
119
Defining the PV Plant's Forecast Data
120
Defining the Feed-In Tariff
121
Fig.: Tariff - Tariff Settings
122
Define Electricity Costs
123
Configuring Notifications
124
Recipient
124
Device Notifications
124
Fig.: Status and Fault Code Groups
124
Fig.: Configuration Example for Filtering Status and Fault Codes
126
Yield
127
Fig.: Entering the Recipient's E-Mail Address
127
Fig.: Defining Notification Times and Setting Types
128
Explanation of the Individual E-Mail Functions
129
Fig.: Example of a Yield Message
129
Fig.: Yield Overview (All INV) in HTML Format
130
Fig.: Yield Overview (All INV & Groups) in HTML Format
130
Text Message (SMS) Notifications
132
Alarm (Only Solar-Log 1000 and 2000)
132
Power & Failure
132
General Information on Performance Monitoring
134
Fig.: Performance Monitoring: Example Plant with Two Inverters
134
Fig.: Configuring Performance Monitoring
135
Fig.: Configuring Module Fields
135
Fig.: Performance Monitoring with Notification and Inverter
137
Smart Energy
139
Defining Smart Energy Switching
139
Fig.: Selecting Switch for Smart Energy
139
Smart Energy Switching Groups
140
Fig.: Creating Switching Groups
141
Fig.: Adjustable Switch with Help Text
143
Configuring Switching Groups
144
Control Logics Definition - Operating Mode Appliances
144
Fig.: Control Logic Configuration Window
144
Control Logics Definition - Operating Mode Generator
150
Fig.: Surplus Management
152
Smart Energy Surplus Management
152
Feed-In Management
154
Plant Parameters
154
Fig.: Configuration of UC and uns at Different Voltage Levels
154
Active Power
156
Active Power Deactivated
157
Remote Controlled Active Power Reduction (Only Solar-Log™ PM+)
157
Fig.: Schematic Diagram of a Ripple Control Receiver with Four Relays
158
Fig.: Channel Settings for Power Reduction
159
Remote Controlled Active Power Reduction with the Calculation of Self-Consumption
160
Lar-Log™ PM+)
160
70% Fixed Reduction
160
70% Fixed Reduction with the Calculation of Self-Consumption
161
Adjustable Reduction
162
Adjustable Reduction with the Calculation of Self-Consumption
162
Fixed Reduction in Watts
163
Fixed Reduction in Watts with the Calculation of Self-Consumption
163
Percentage of Consumption for an Adjustable Reduction
163
Reactive Power
164
Reactive Power Deactivated
164
Fixed Value Cos (Phi) Shift Factor
165
Fixed Reactive Power in Var
165
Variable Cos (Phi) Shift Factor over Characteristic Curve P/Pn
166
Variable Reactive Power Via the Characteristic Curve Q(U)
167
(Only Solar-Log 2000 with Utility Meter)
167
Fig.: Q(U) Control Function Diagram
168
Fig.: Schematic Diagram of a Ripple Control Receiver with Four Relays
170
Remote-Controlled Fixed Value Cos (Phi) Shift Factor Only Solar-Log™ PM+)
170
Fig.: Channel Settings for Remote Controlled Cos (Phi)
171
Fig.: Switching to Reactive Power Characteristic Curves with Certain Signals
171
Linking (Only Solar-Log 1000 and 2000)
172
Fig.: Solar-Log™ Network Configuration
172
Profile
173
Fig.: Activated PM+ Profile for a PM Package
173
Direct Marketing
175
Editing Data
176
Initial Yield
176
Data Correction
177
System Backup
177
Backup
179
Reset
181
System Configuration
183
Access Control
183
Language/Country/Time
184
Fig.: Configuring the Time on the Solar-Log
184
Display
186
Licenses
187
Firmware
187
Accessing Diagnostic Values
190
Inverter Diagnostic
190
Inverter Details
191
Fig.: Inverter Details Graph
191
Fig.: Tracker Comparison Graph
192
Tracker Comparison
192
Module Field Comparison
193
Fig.: Module Field Comparison Graph
193
Battery Diagnostic
194
Current Measurement Values
194
Fig.: Battery Diagnosis - Current Measurement Values
194
Charging History 1-Day
195
Fig.: Battery Diagnosis - Charging History 1-Day
195
Charging History 7-Days
196
Balances
197
Fig.: LCD Display with the Battery Symbol and One Element
197
Fig.: Battery Diagnosis - Balance
198
Fig.: Event Log
199
Fig.: the Event Log Is Being Loaded
199
Accessing Event Logs
199
Accessing Notifications
200
Fig.: Notification Overview
200
Fig.: Message with Text Field
201
Accessing Feed-In Management
202
Fig.: Feed-In Management - Control State
202
Explanation of the Values in the Power Reduction Section
203
Explanation of the Symbols in the Feed-In Power (% DC) Column
206
Explanation of the Values in the Reactive Power Reduction Section
206
Fig.: Feed-In Management - Feed-Balance
208
PM History
209
Fig.: PM History
209
Accessing the SCB Monitor (Only Solar-Log 1000 and 2000)
210
Accessing Components
211
Fig.: Components - S0 Meter on Interface a and B
211
Fig.: Alarm Contact
212
Fig.: Connection Test - Wireless Package
212
Smart Energy
214
Explanations of the Tabs
214
Fig.: Smart Energy Status (Current)
215
History Section
216
Fig.: Smart Energy History - Example of Priority 1
216
Simulation Section
218
Fig.: Smart Energy - Simulation with EGO - Surplus Priority 1
218
Fig.: CSV Export
220
Accessing CSV Export
220
Accessing Support
221
Fig.: Support - General
221
Accessing Yield Data
222
Current Values
222
Fig.: the Plant's Current Values (Cockpit View)
222
Energy Flow
224
Fig.: Example of a Plant with an Energy Flow
224
Table
225
Fig.: Table with the Recorded Output from an Example Plant
225
Production
226
Fig.: Graphic Display of the Plant's Total Production
226
Fig.: Daily View of the Production Graph with the Auto Scaling Activated
227
Day View
227
Fig.: Day View of the Production Table
228
Month View
229
Fig.: Month View Production Graph
229
Fig.: Month View of the Production Table
230
Year View
231
Fig.: Year View Graph
231
Total View
232
Fig.: Total View Graph
232
Consumption (Only When Consumption Meters Are Connected)
233
Fig.: Graph of Daily Consumption with Connected Appliances in the Sub-Consumer View
236
Fig.: Graph of Daily Consumption with Connected Appliances and Active Line Graphics in the Sub-Consumer View
237
Balances
239
Fig.: Day Balance Graph with Battery System
240
Day Balance
241
Fig.: Daily Balance Graph with the Auto Scaling Activated
241
Month Balance
242
Fig.: Month View Balance Graph
242
Year Balance
243
Fig.: Year View Balance Graph
243
Total Balance
244
Fig.: Total Balance Graph
244
Finances
245
Fig.: Finances Overview
245
Sensor (Only When a Sensor Is Connected)
247
Fig.: Graph of Sensor Box Values
247
Fig.: System Information from an Example Plant
248
System Information
248
Direct Device Configurations (Solar-Log 1200 and 2000)
250
Navigating from the Touch Screen
250
Fig.: Start Page of the Display
250
Accessing the Dashboard
252
Fig.: Dashboard View
252
Access Energy Flow
253
Fig.: Energy Flow View
253
Accessing the Energy Balance
254
Fig.: Energy Balance View
254
Start Smart Energy
255
Fig.: Smart Energy View
255
Accessing Forecast
256
Fig.: Forecast View
256
Accessing Yield History
257
Accessing Environmental Performance
257
Fig.: Yield History - Balance - Day
257
Fig.: Environmental Performance - Day View
257
Settings on the Device
258
Start Menu (Only Solar-Log1200)
258
Fig.: Display: Initial Configuration Language Selection
259
Fig.: Display: IP Address Settings in the Initial Configuration
259
Fig.: Initial Configuration - Device Selection
260
Fig.: Device Classes - Definition
260
Fig.: Interface Definition
261
Fig.: Inverter Selection
261
Fig.: Inquary about a Connected Wireless Package
262
Fig.: Configuring the Baud Rate
262
Fig.: Display: Device Detection
263
Fig.: LCD: Number of Detected Inverters
263
Fig.: Display: Device Detection Completed
264
Fig.: Display: Start Easy Installation
264
Basic Settings Menu
265
Fig.: Network Settings Page1 on Solar-Log 1200 Display
265
USB Menu
266
Advanced Settings Menu
269
Fig.: Slide Show Dialog
270
Fig.: Display Brightness
270
Fig.: Display Access Control
271
Fig.: System Settings - Initialize Yield Data
271
Fig.: Display Firmware
272
Fig.: Language Selection
272
Fig.: Country Settings
273
Error and Fault Messages on the Display
274
Fig.: Tachometer - with a Warning (Red Triangle) in the Top Line
274
Fig.: Loaded Notifications
274
Notifications on the LCD Status Display
276
Meaning of the Symbols on the LCD Display
276
Fig.: LCD Display - All Symbols Active
276
Fig.: LCD Display - Meaning of the Symbols
277
Fig.: Example for a Blinking Code Sequence for Internet - Fault 4
278
Fig.: Blinking Internet Symbol
278
Fault Messages
278
Notifications on the LCD Display
279
Normal Operation
279
Power Reduction
279
Fig.: LCD Display During Normal Operation
279
Fig.: Display 70% Fixed Reduction
279
Faults
280
Restarting and Resetting
280
Reset Buttons
280
Reset
280
Fig.: Reset Buttons
280
Restoring the Factory Settings
281
Rebooting and Resetting Via the Web Menu
282
Fault Messages
283
Fault Messages GPRS
283
Fault Messages Time
284
Fault Messages Wifi
284
Fault Messages Internet
285
Fault Messages Export to External Server and Backup
286
Fault Message E-Mail Transfer
288
Portal Transfer Fault Messages
290
Fault Messages Feed-In Management
290
Special Cases
291
Cleaning and Care
292
Cleaning Tips
292
Care Tips
292
Disposal
293
Technical Data
294
Appendix
298
Internet Ports
298
Country Specific Inverter Detection with Easy Installation
299
Wiring Meters to Record Self-Consumption
300
Meter Connection Options to Record the Total Consumption Via an RS485/S0 Interface
300
Fig.: Wiring Diagram for Recording Self-Consumption
300
Meter Connection Options for Bi-Directional Recording of the Total Consumption Via Only an RS485 Interface
301
Fig.: Wiring Diagram for Recording Self-Consumption - Bidirectional Meter
301
Connection Examples for Ripple Control Receivers
302
Variation with 4 Relays (ENBW >100Kwp)
303
Fig.: Wiring a Ripple Control Receive with Two Relays - Example 1
303
Fig.: Channel Settings for Active Power Reduction - Example 1
304
Variation with Two Relays
305
Fig.: Wiring a Ripple Control Receive with Two Relays - Example 2
305
Variation with Three Relays
307
Fig.: Wiring a Ripple Control Receive with Two Relays - Example 3
307
Fig.: Channel Settings for Active Power Reduction - Example 3
308
Variation with 5 Relays (Including Emergency Stop)
309
Fig.: Wiring a Ripple Control Receive with Two Relays - Example 4
309
Digital Interfaces
311
Modbus TCP
311
Live Data Compact - Summarized (Complete Plant)
312
Open JSON Interfaces
313
Dimensions
315
List of Figures 26 List of Figures
316
List of Figures
316
Other manuals for Solar-Log 200
Installation Manual
224 pages
User Manual
104 pages
5
Based on 1 rating
Ask a question
Give review
Questions and Answers:
Need help?
Do you have a question about the Solar-Log 200 and is the answer not in the manual?
Ask a question
Solar-Log 200 Specifications
General
Brand
Solar-Log
Model
200
Category
Measuring Instruments
Language
English
Related product manuals
Solar-Log 2000
319 pages
Solar-Log 250
319 pages
Solar-Log 300
158 pages
Solar-Log PRO380-CT
4 pages
Solar-Log Pro 380
4 pages
Solar-Log 1200
319 pages
Solar-Log 500
319 pages