EasyManuals Logo

Solar-Log 200 User Manual

Solar-Log 200
319 pages
To Next Page IconTo Next Page
To Previous Page IconTo Previous Page
Page #231 background imageLoading...
Page #231 background image
231
Accessing Yield Data
18.2.3 Year view
The tab Year displays the monthly yields from the year as a total in a bar graph.
Move the mouse above one of the bars to display the monthly yield with a comparison of the cur-
rent and target values in regard to the annual forecast.
Click on a bar to go to the corresponding month view.
Fig.: Year view graph
When you click on Table, the annual values for the entire year are allocated to each month according to
the actual output generated.
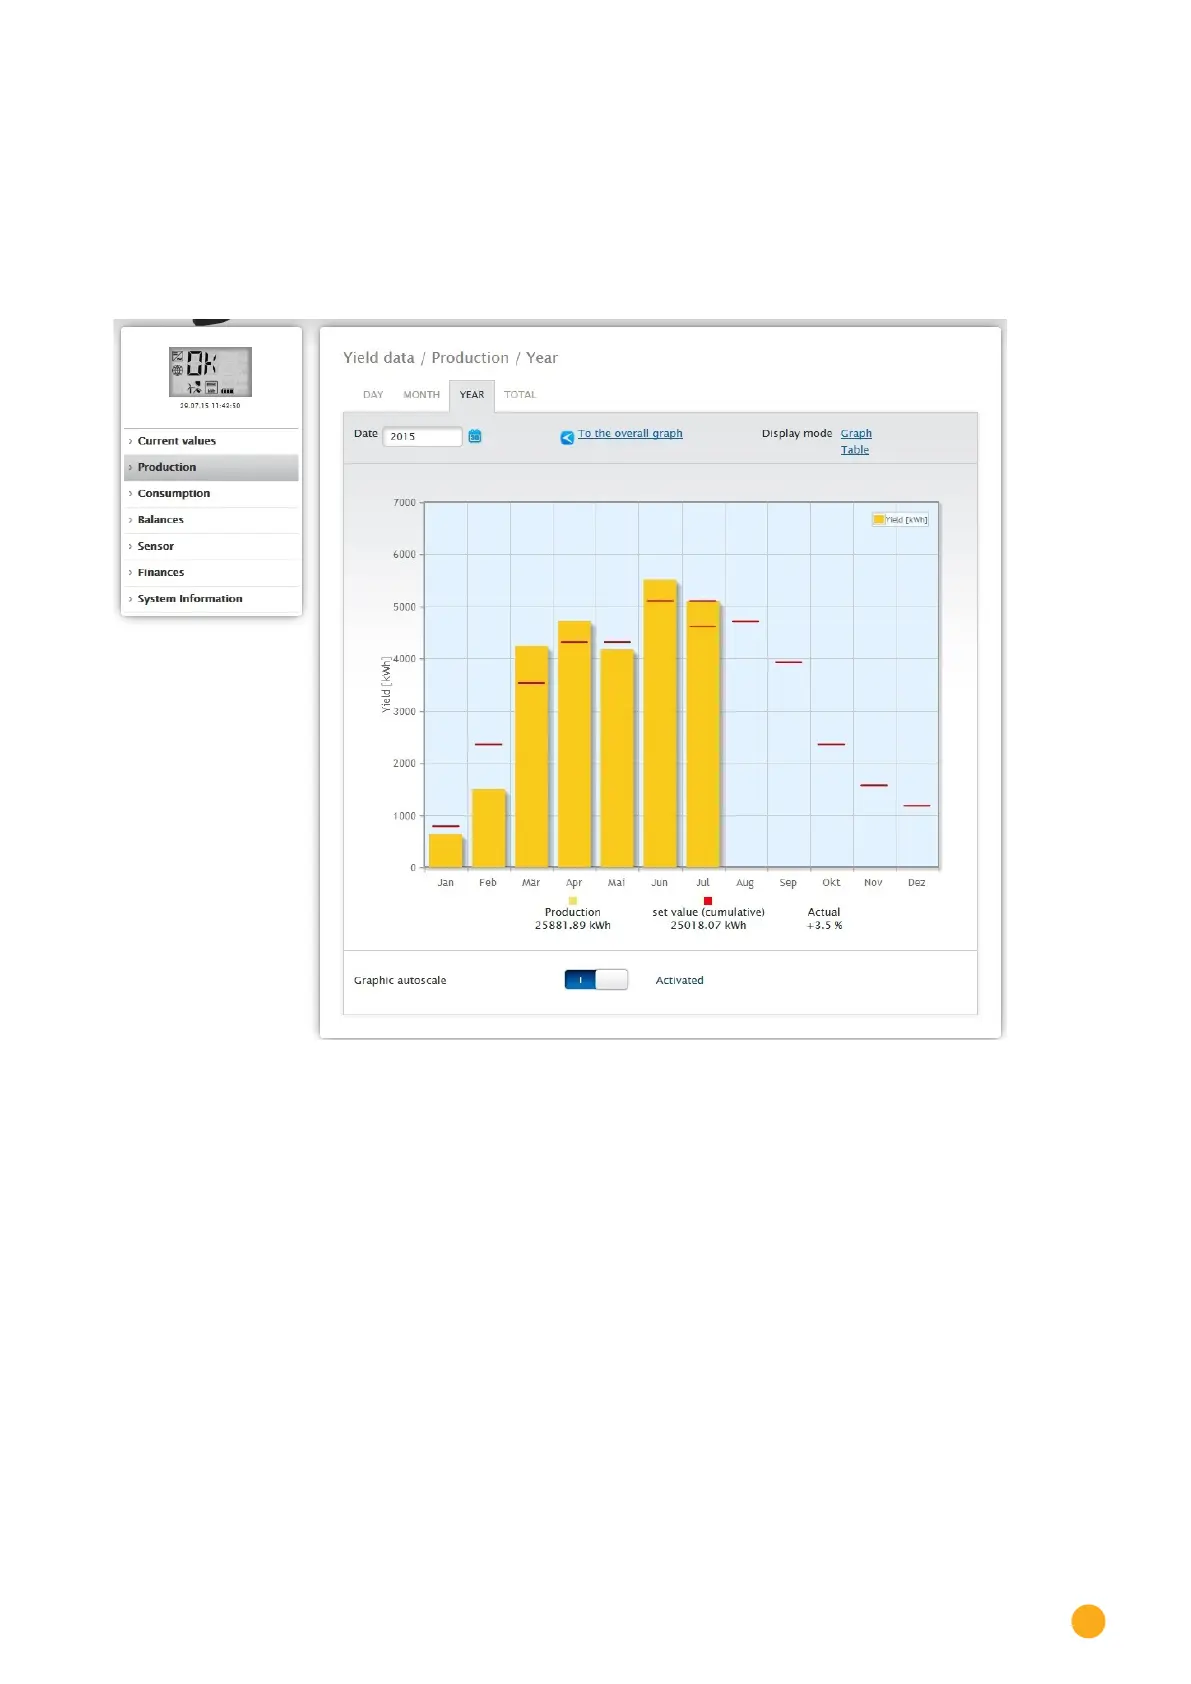
Table of Contents

Other manuals for Solar-Log 200

Questions and Answers:

Question and Answer IconNeed help?

Do you have a question about the Solar-Log 200 and is the answer not in the manual?

Solar-Log 200 Specifications

General IconGeneral
BrandSolar-Log
Model200
CategoryMeasuring Instruments
LanguageEnglish

Related product manuals