69
Note For 5000 Bird Dog Plus Users Using SpinGraph SE: Go to Step 4.1 and perform a
Gain/Loss Analysis. After that print the report similar to what you see in Steps 4.5
through 5.5. Only SpinGraph Deluxe has the PDF and E-Mail capability directly from
SpinGraph.
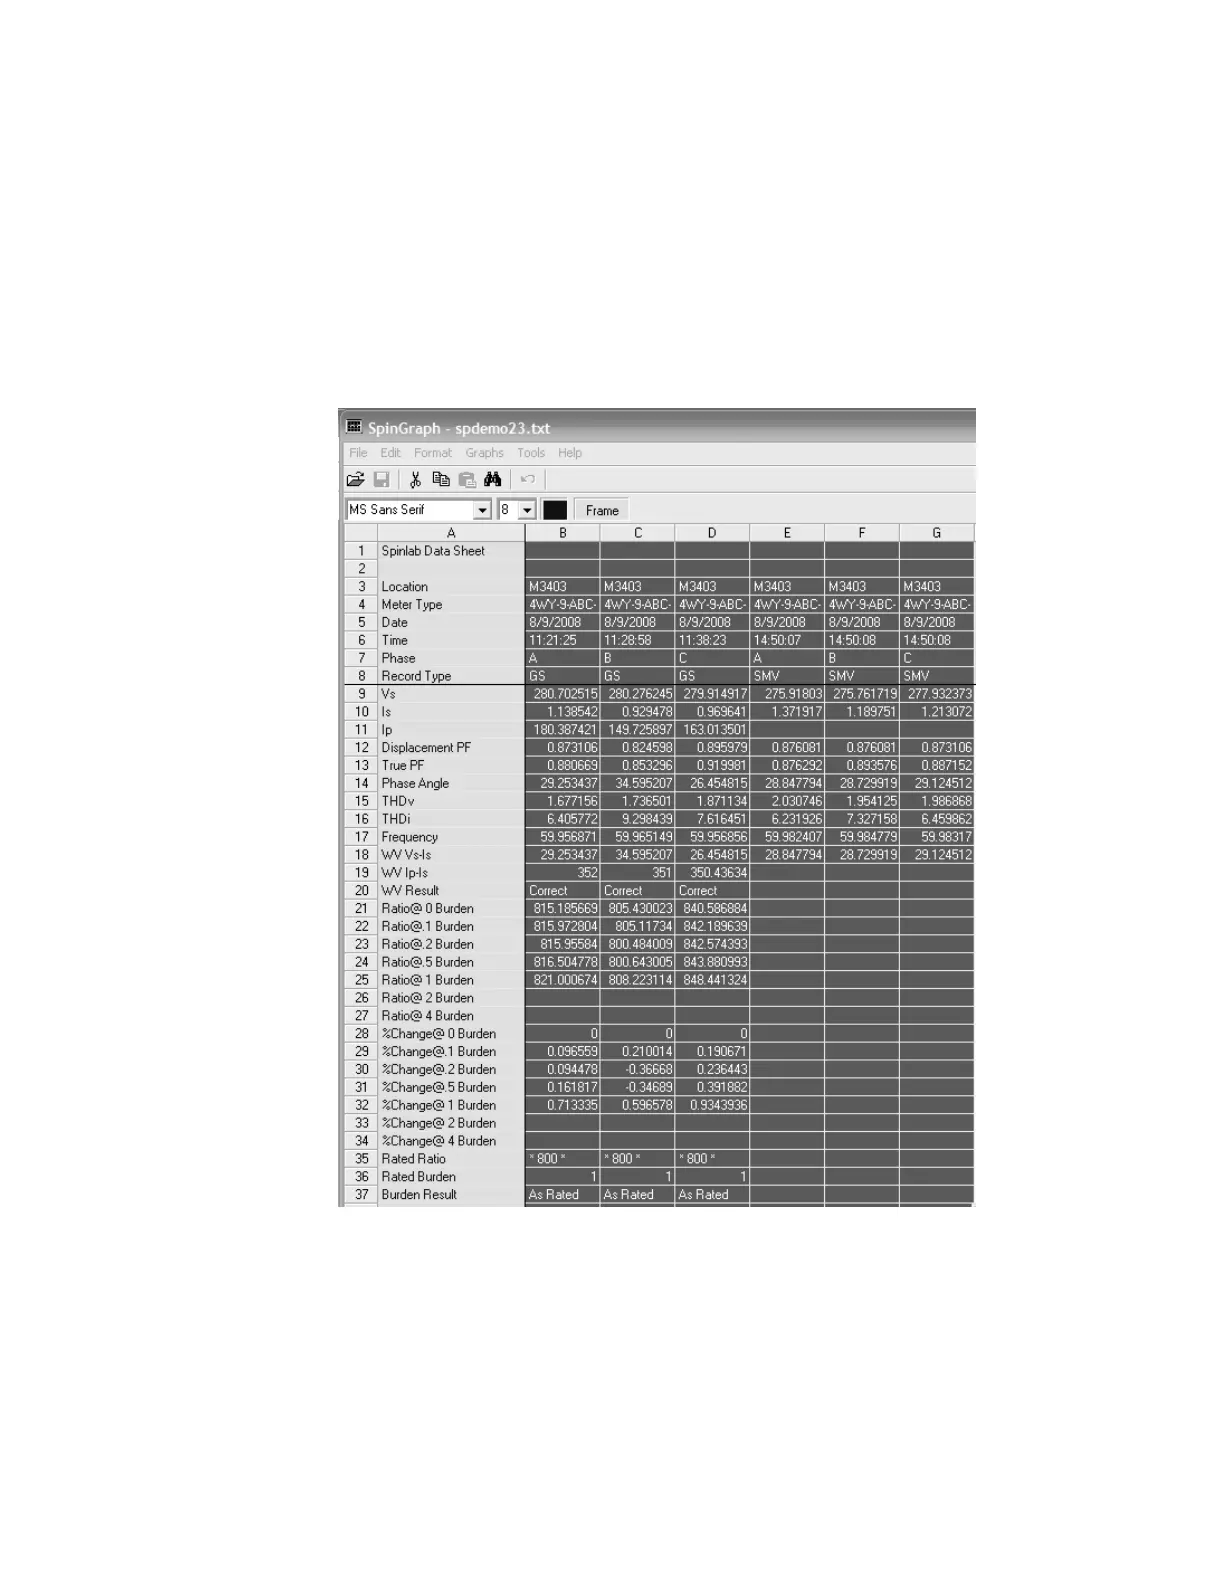
Steps 3.6 & 3.7—Click on the X in the top right-hand corner and go back to the Spinlab Data
screen. Highlight the columns of data you want to graph. In this case we are
going to graph 6 columns of data: 3 for the meter circuit (B, C, & D) & 3 for the
meter (D, E, & F). These 6 columns of data comprise a true 3 phase site
analysis.
 Loading...