UM1467 Using IAR Embedded Workbench® for ARM
Doc ID 022172 Rev 1 12/46
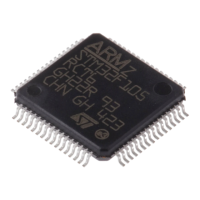
4. If your project is successfully compiled, the following window in Figure 4 is displayed.
Figure 4. EWARM project successfully compiled
6.2 Debugging and running your EWARM project
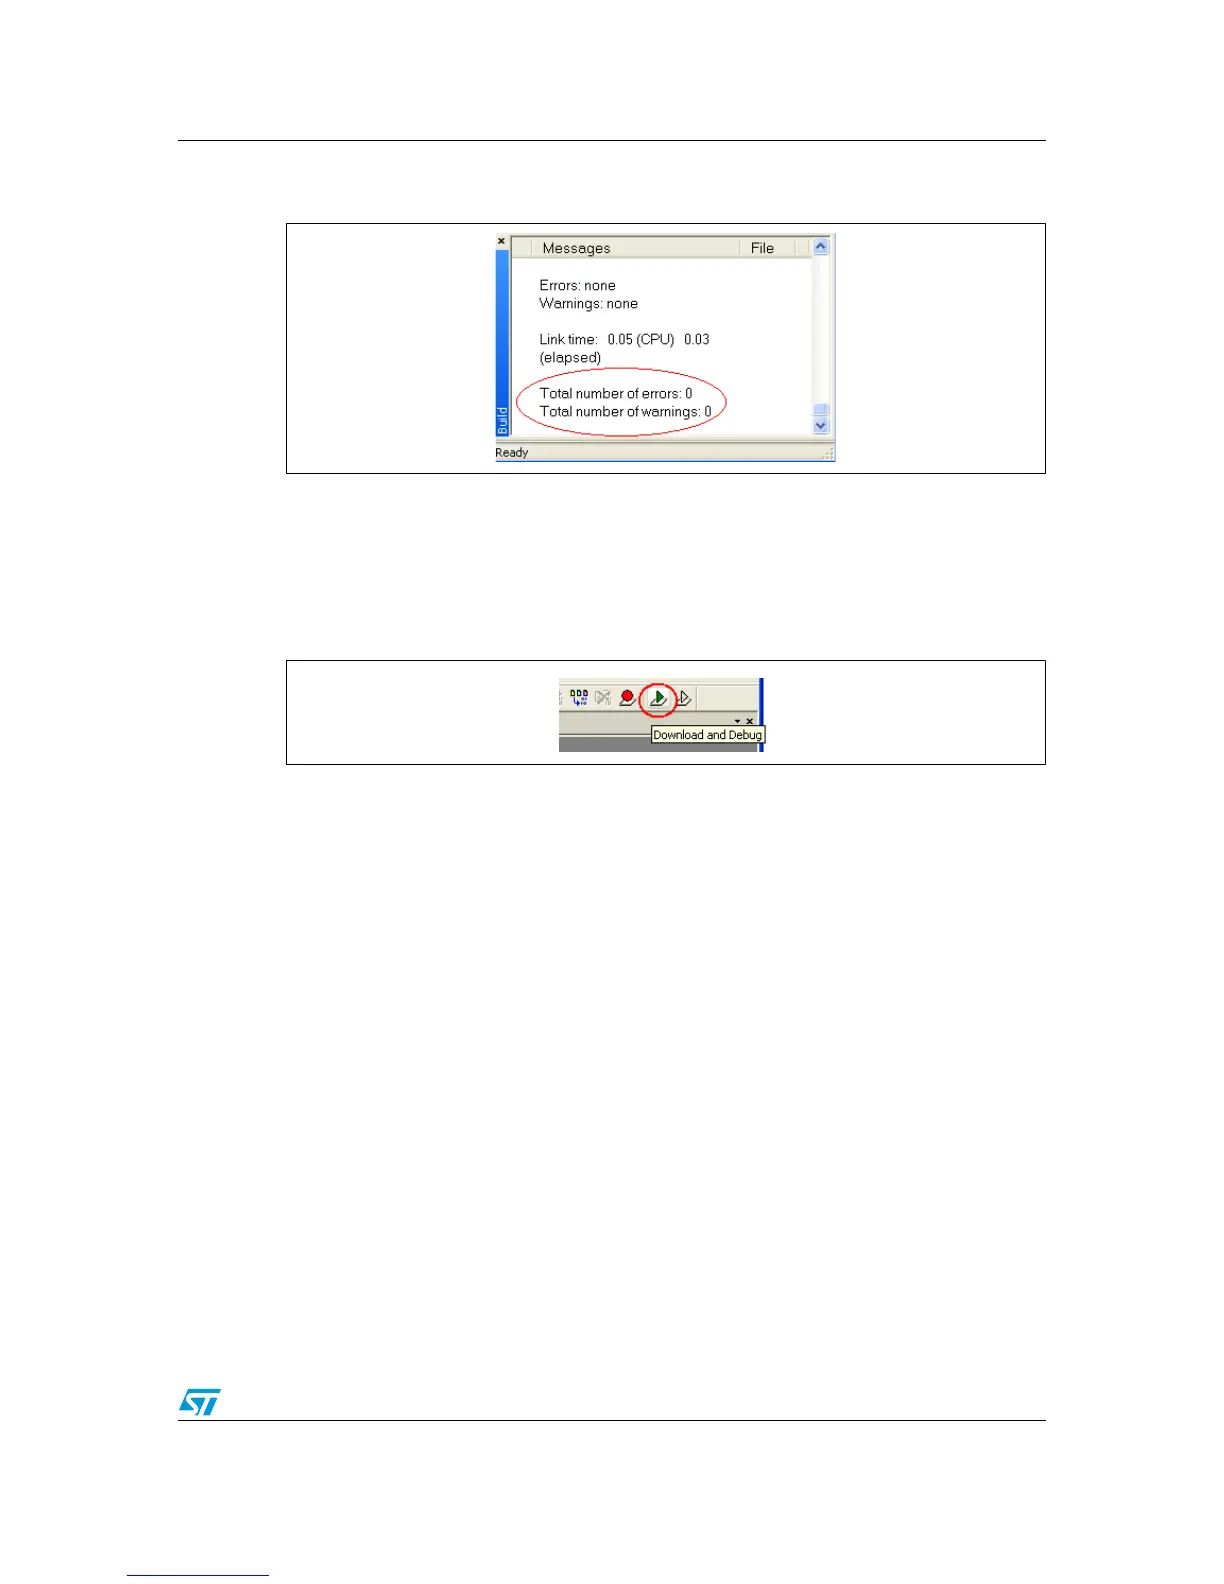
In the IAR Embedded Workbench IDE, from the Project menu, select Download and
Debug or, alternatively, click the Download and Debug button the in toolbar, to program the
Flash memory and begin debugging.
Figure 5. Download and Debug button
The debugger in the IAR Embedded Workbench can be used to debug source code at C
and assembly levels, set breakpoints, monitor individual variables and watch events during
the code execution.
 Loading...