UM1467 Using Atollic TrueSTUDIO®
Doc ID 022172 Rev 1 32/46
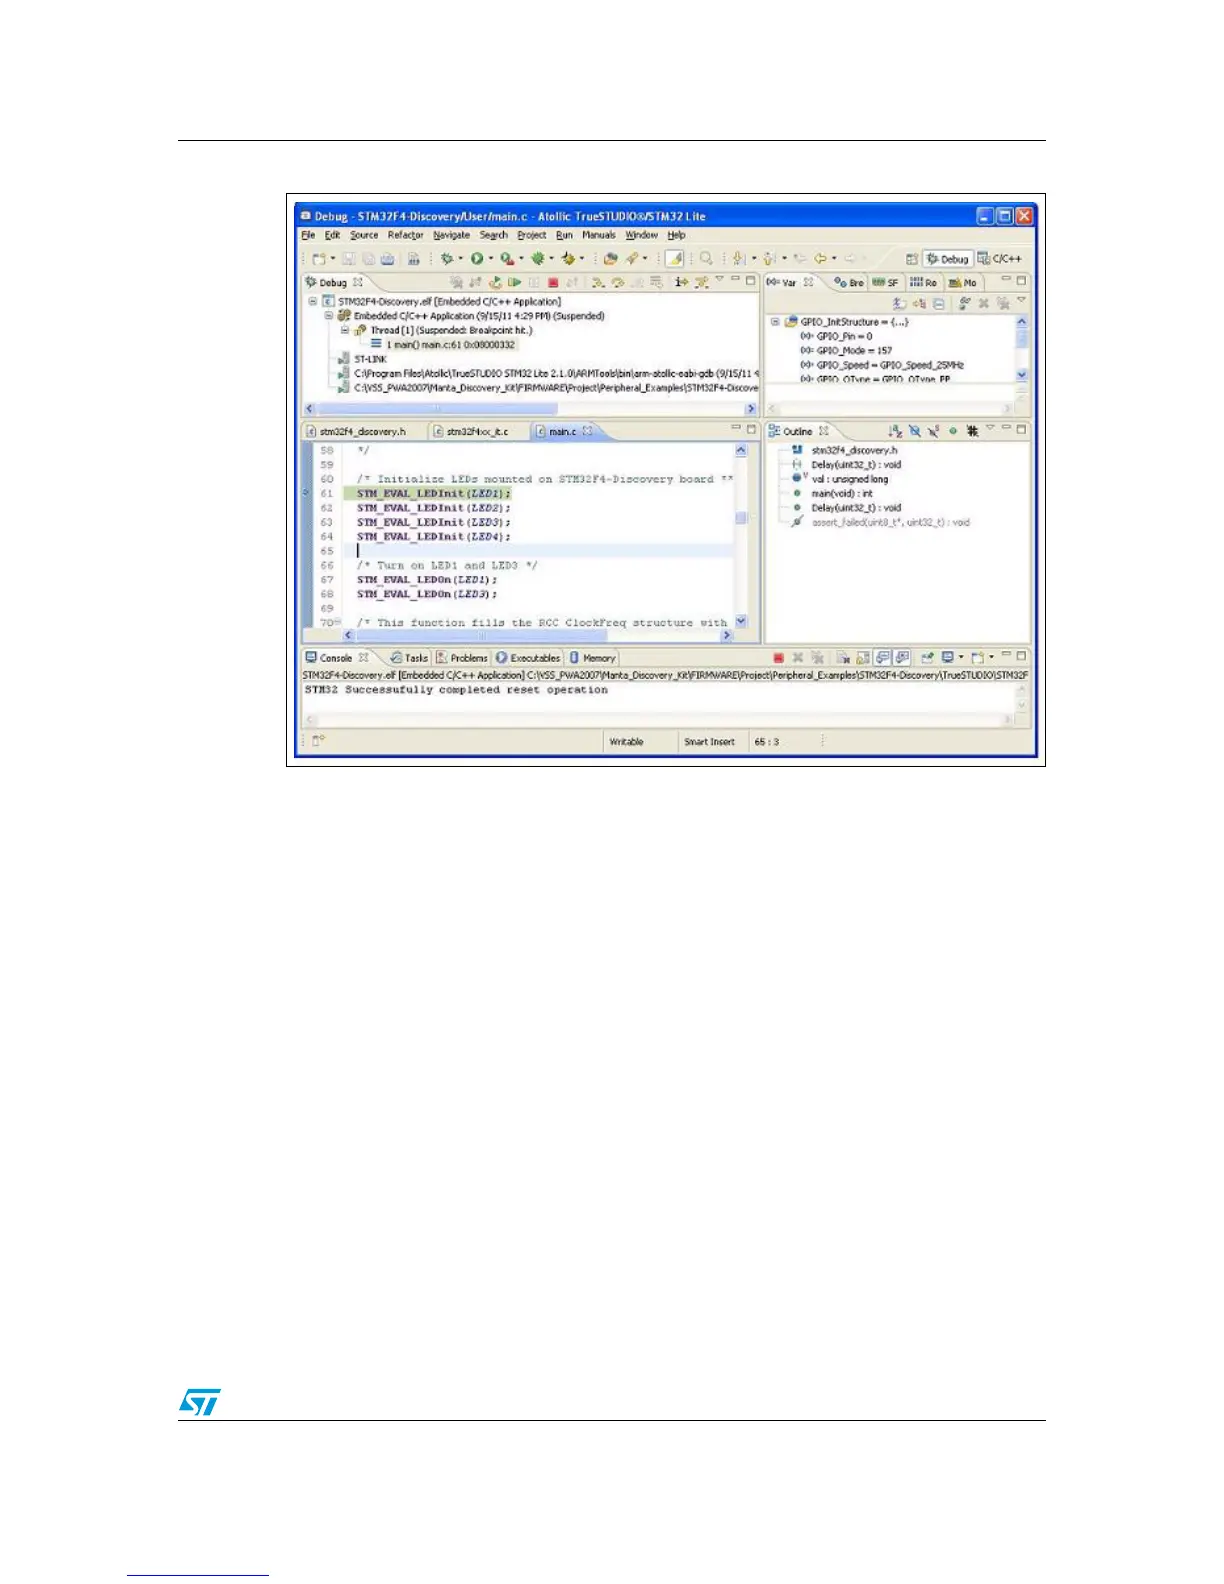
Figure 42. TrueSTUDIO Debug window
The debugger in the Atollic TrueSTUDIO can be used to debug source code at C and
assembly levels, set breakpoints, monitor individual variables and watch events during the
code execution.
To run your application, from the Run menu, select Resume, or alternatively click the
Resume button in the toolbar.
8.3 Creating your first application using TrueSTUDIO toolchain
TrueSTUDIO includes a dedicated connection to the STM32F4DISCOVERY board. When
choosing this connection, all required files (startup file, firmware library, etc.) are added to
the workspace and sample files are generated in the project folder to simplify development.
The debug settings are automatically configured by selecting STM32F4DISCOVERY as the
evaluation board.
Follow these steps to create your first application using TrueSTUDIO toolchain.
1. Open the TrueSTUDIO®/STM32 product folder and select the Atollic TrueSTUDIO®
STM32 product name. The program launches and asks for the Workspace location.
Browse to select an existing workspace, or enter a new workspace location and click
OK to confirm.
 Loading...