ANALYZE Area
QB Expert Alpha Controller
82
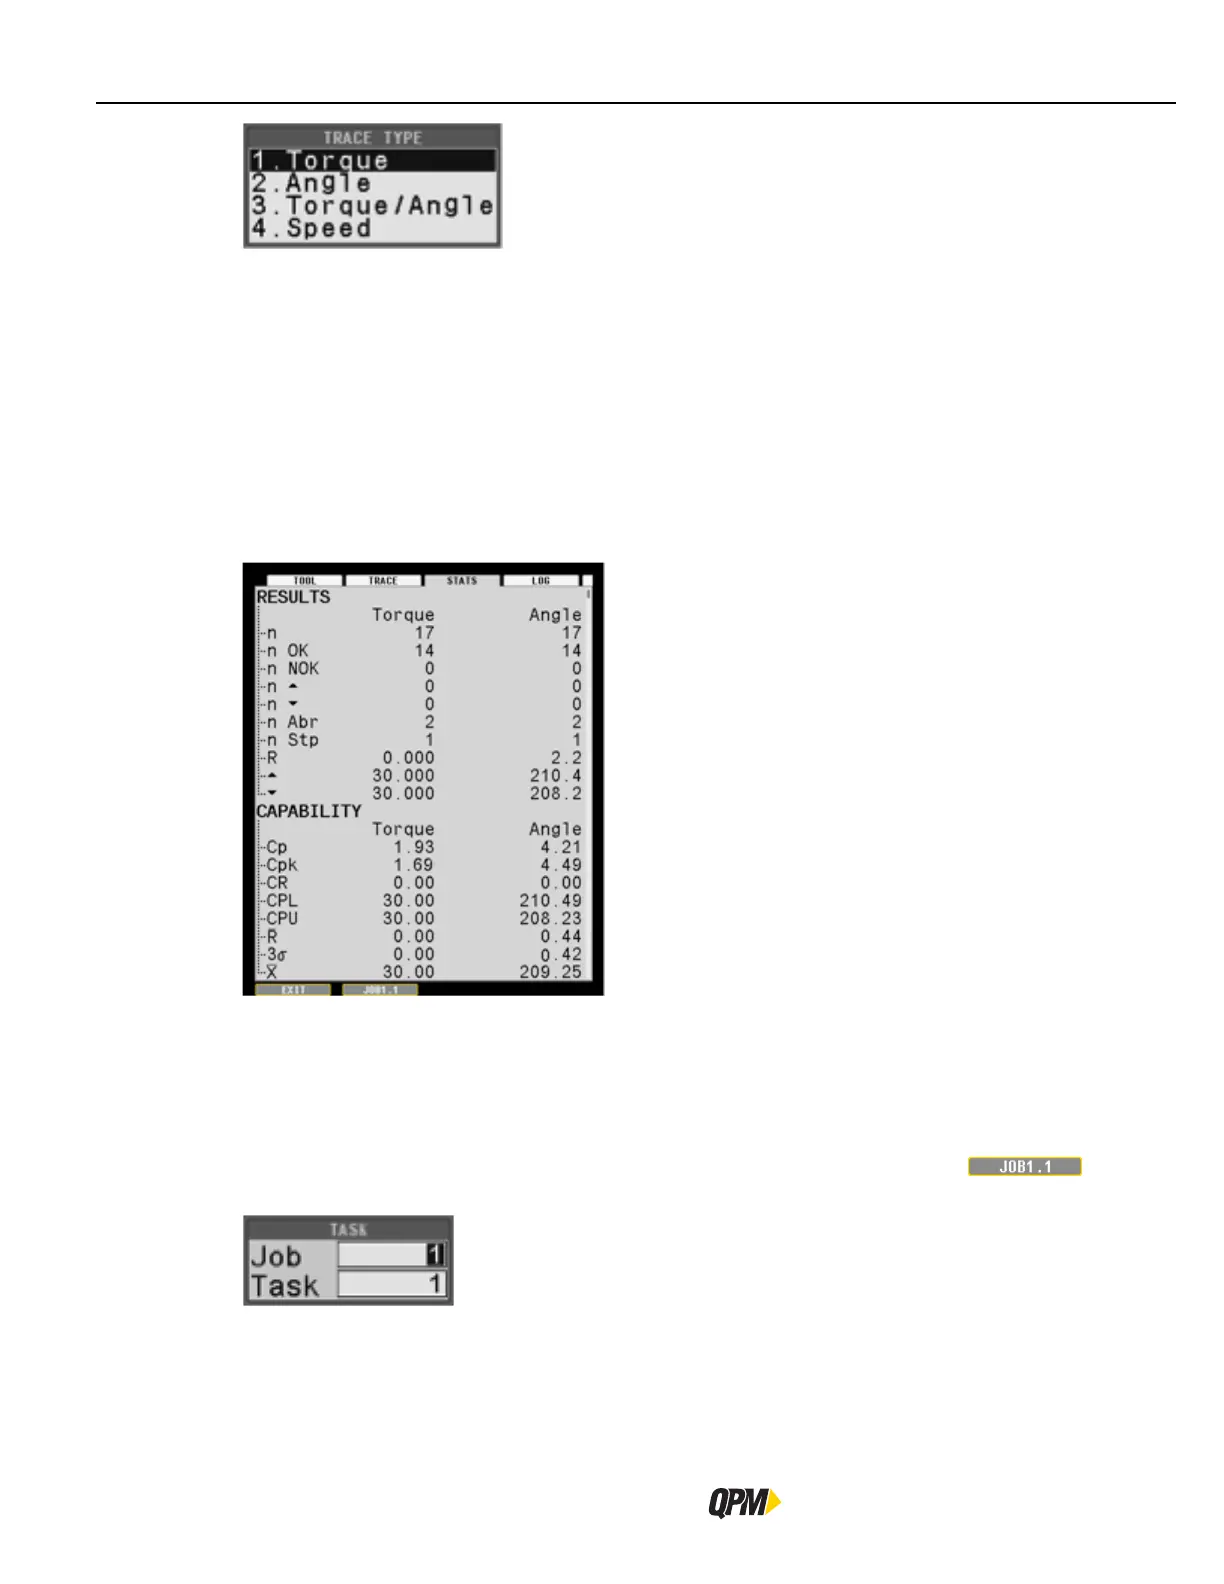
Torque – Displays Torque vs. Time.
Angle – Displays Angle vs. Time.
Torque/Angle – Displays Torque vs. Angle.
Speed – Displays Speed vs. Time.
Torque Rate – Displays the Torque Rate vs. Time.
Use the right arrow to move to the next tab or press EXIT to save the changes and return to the Run screen. See
section “3.1.2.6 Exit” on page 52.
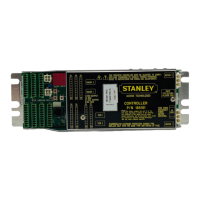
3.3.3 STATS Tab
Press the right arrow to enter the Statistics area of the controller.
Alpha controllers maintain both sample and population statistics. Sample statistics are calculated using the last
completed subgroup of fastening cycles for a given Task. The subgroup size is set using Subgroup Size. Population
statistics are calculated using all of the fastening cycles for a given Task up to the population.
To be included in sample or population statistics, a rundown must exceed the Task’s Threshold Torque and
Statistical Torque and the fastening cycle must not be marked as a STOP or ABORT shutoff code.
The statistics are calculated for Torque and Angle. Data is filtered by Task. Press the interactive
menu button and choose the Job and Task under analysis.
Values are recalculated each time a tab is selected.
Results
This section shows a summary of the fastening cycle data results stored in the controller.
n – Shows the number of rundowns included in the population size.