3.3.2 Information
The information shown on the display is described below using illus-
trative examples.
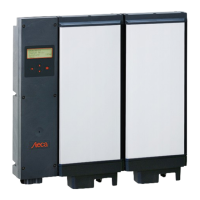
The status display shows the following values:
①
Measurement name
②
Measurement with units
③
Date is displayed alternatingly with IP address
④
Cover the Non-confirmed event messages; more information on
this is provided in Section
Ä
„Event messages“ on page 51
⑤
Animated symbol Connect symbol with 2‑digit inverter address;
indicates data traffic on the RS485 bus.
⑥
Cover the Power reduction (Derating)
⑦
Cover the Fixed voltage mode activated
⑧
Time
⑨
IP address of the device when a network connection has been
established, display alternates with ③ – ⑦
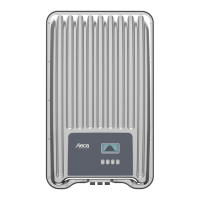
The following applies to the status display:
n The measurements shown in the status display are defined
under Settings ▶ Meas. values. Some measurements are
always displayed (default setting).
n Current values are not displayed at night (solar irradiation too
low; example in Fig. left).
n The CO2 saving shown in the status display are calculated
using the savings factor 508 g/kWh .
Daily, monthly and annual yields can be displayed numerically in a
list.
①
Yield period (day/month/year)
②
Individual yields with period and value (1 per row)
The yield periods contain the following numbers of individual
entries:
n Day yield: last 31 days
1)
n Monthly yield: last 13 months
1)
n Annual yield: last 30 years
1)
1)
A yield value of 0 is shown when the inverter was not yet installed
at that time.
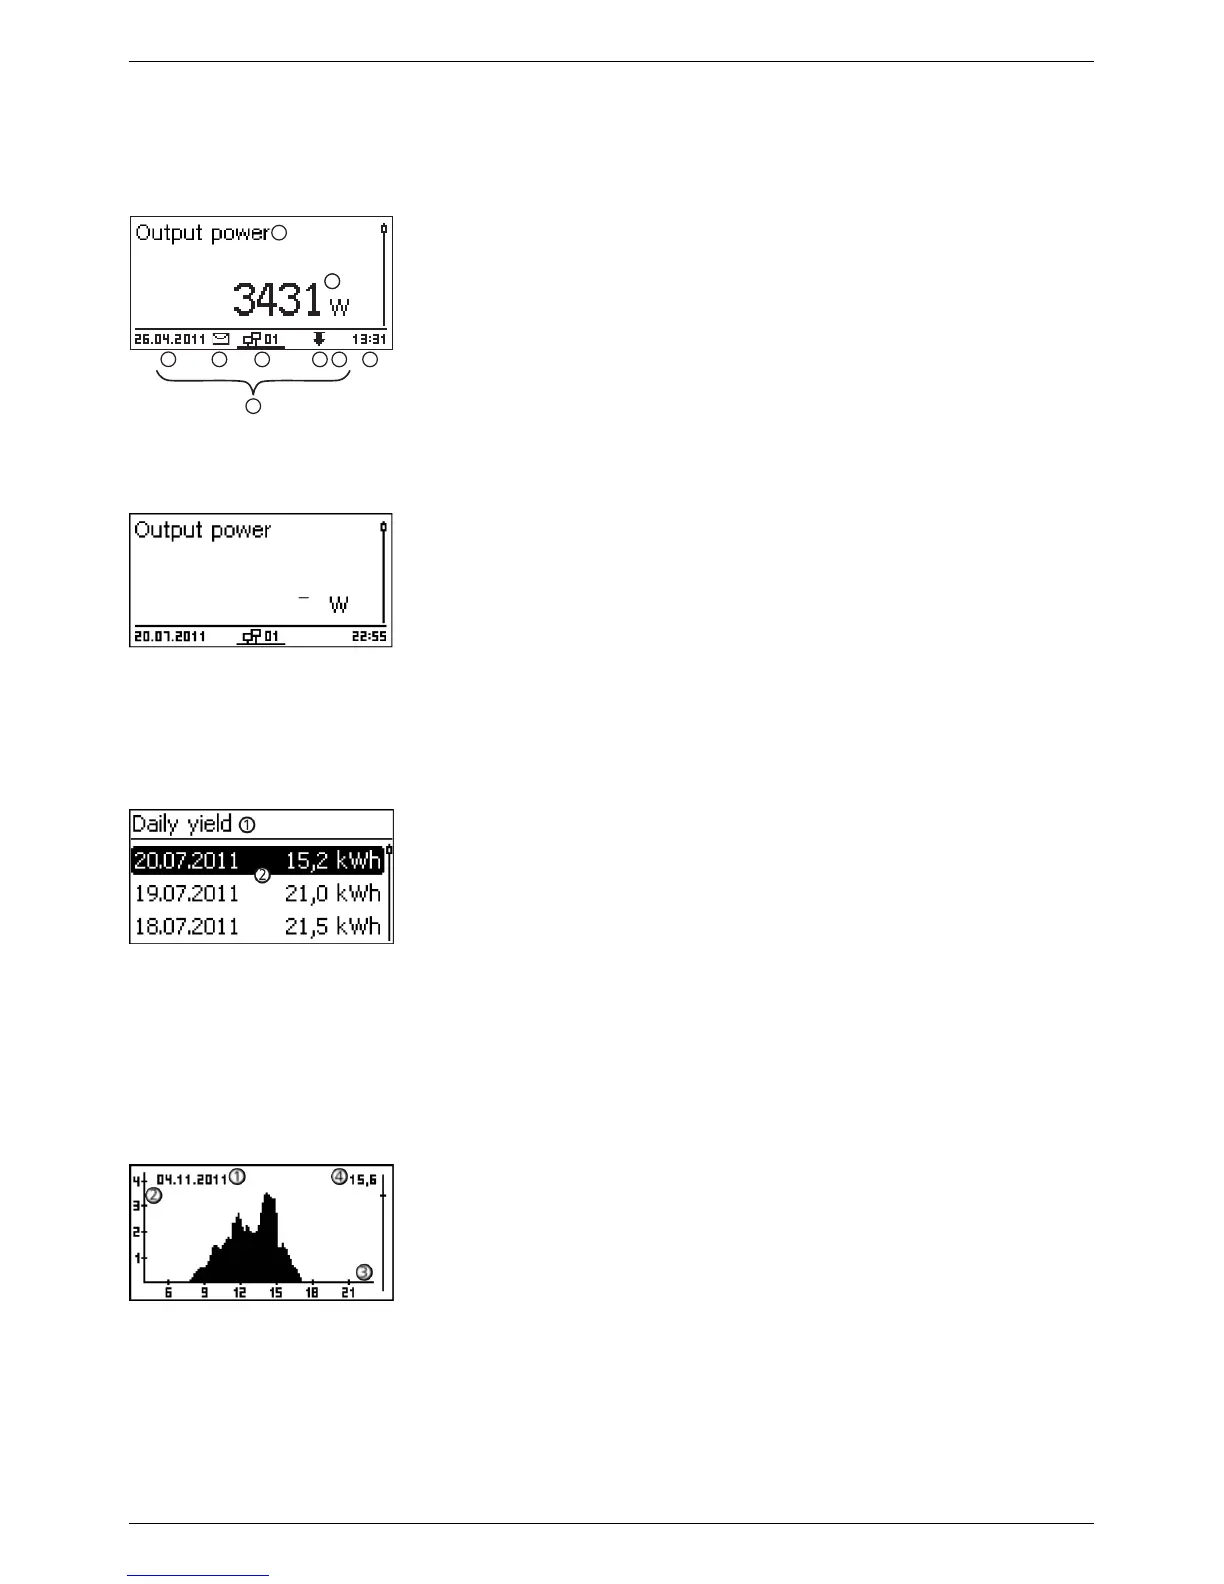
Daily
, monthly and annual yields can be displayed graphically in a
chart.
①
Period on an individual yield (here: day yield)
②
Y axis
1)
2)
3)
③
X axis: Time in hours/days/months/years
④
Total of all individual yields shown in the diagram, in kWh
The graphical representation can show annual yields for the last 20
years.
1)
Yield in kWh
2)
With addition of „M“ : : yield in MWh
3)
The scaling changes depending on the maximum value.
Status display