TDS2000C Series Oscilloscope www.tektronix.com/tds2000 17
Power Line Harmonic Analysis (continued)
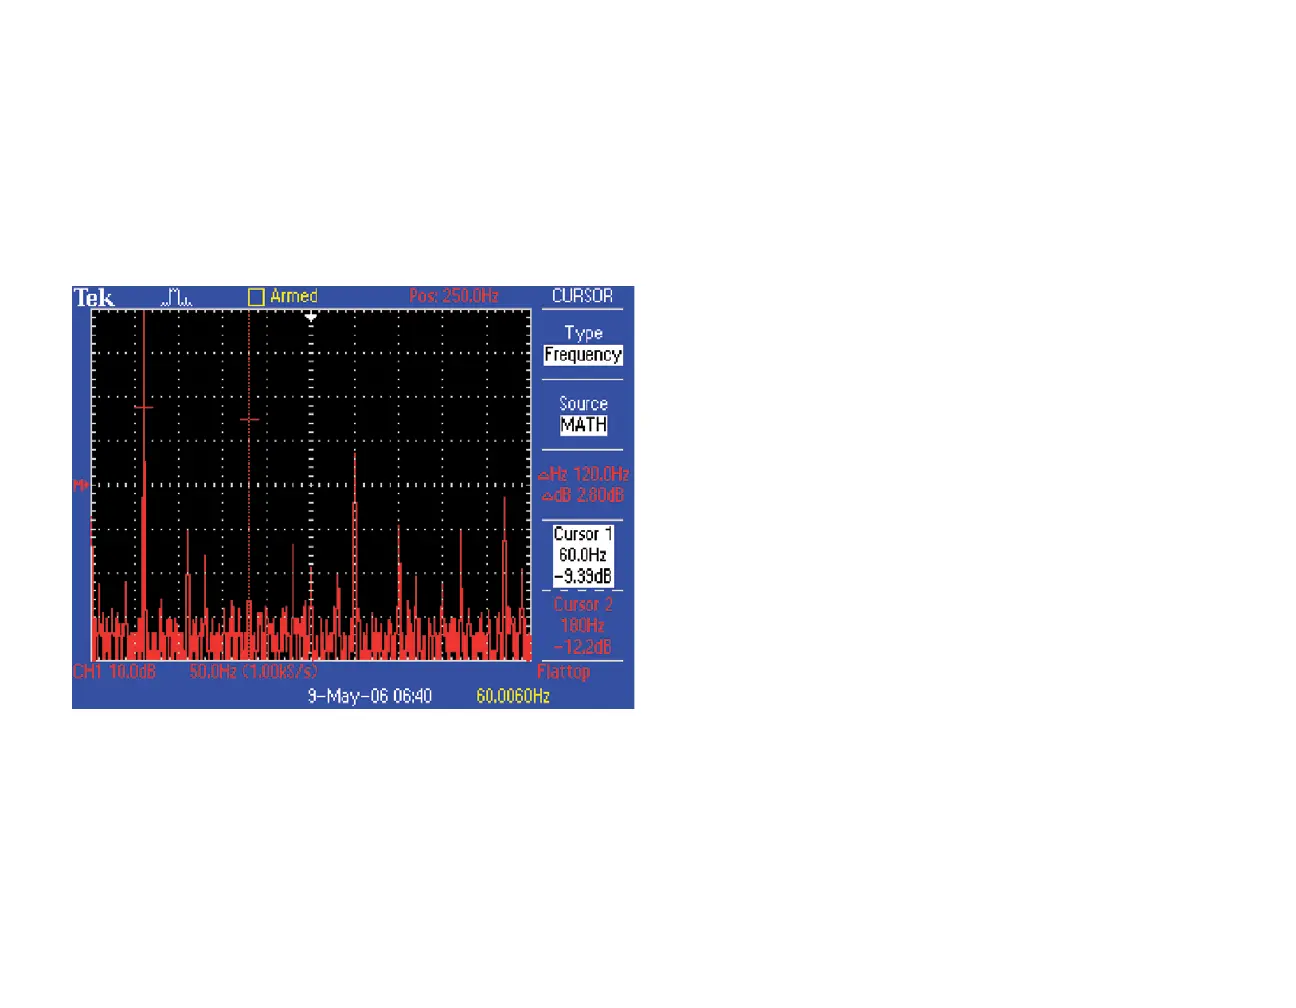
The FFT display provides a frequency-domain display of the power
line signal, including the fundamental power line frequency and the
harmonics at integer multiples of the fundamental frequency. The
TDS2000C cursor measurements provide an easy and accurate way
to analyze this complex display.
1. Press the CURSOR front panel button.
2. Press the Source side menu button until MATH is selected.
3. Press the Type side menu button until Frequency is selected.
4. Press the Cursor 1 side menu button and use the multipurpose
knob to align the cross-hair cursor on the left-most peak (the
fundamental).
5. Press the Cursor 2 side menu button and use the multipurpose
knob to align the cross-hair cursor on the next-highest peak (the
3rd harmonic, in this case).
6. The readouts at the right of the screen indicated the absolute
and relative frequencies and magnitudes.
 Loading...