5 – Operating Software
DPN 402196 Issue 4.1 © Teledyne TSS 5- 17
5.3.2.3 Toggle Swath Width
Availability only to the 350/350 Powertrack system, the Swath Width Display on the Run Window can
be modified to meet specific survey requirements. This allows the user to alter the swath scale display
dependent upon their needs.
5.3.2.4 Scope and Spectrum Analyser Window
Use the command on the View menu or the toolbar button to display the Scope and Spectrum Analyser
window. You must close the Run Window (or Forward Search Window on a 350 System) before you
can access this command using either the menu or the toolbar button.
DeepView for Windows can show signal data received using different styles of ‘oscilloscope’ and
‘spectrum analyser’ displays. (The spectrum analyser feature applies to the 350 System only).
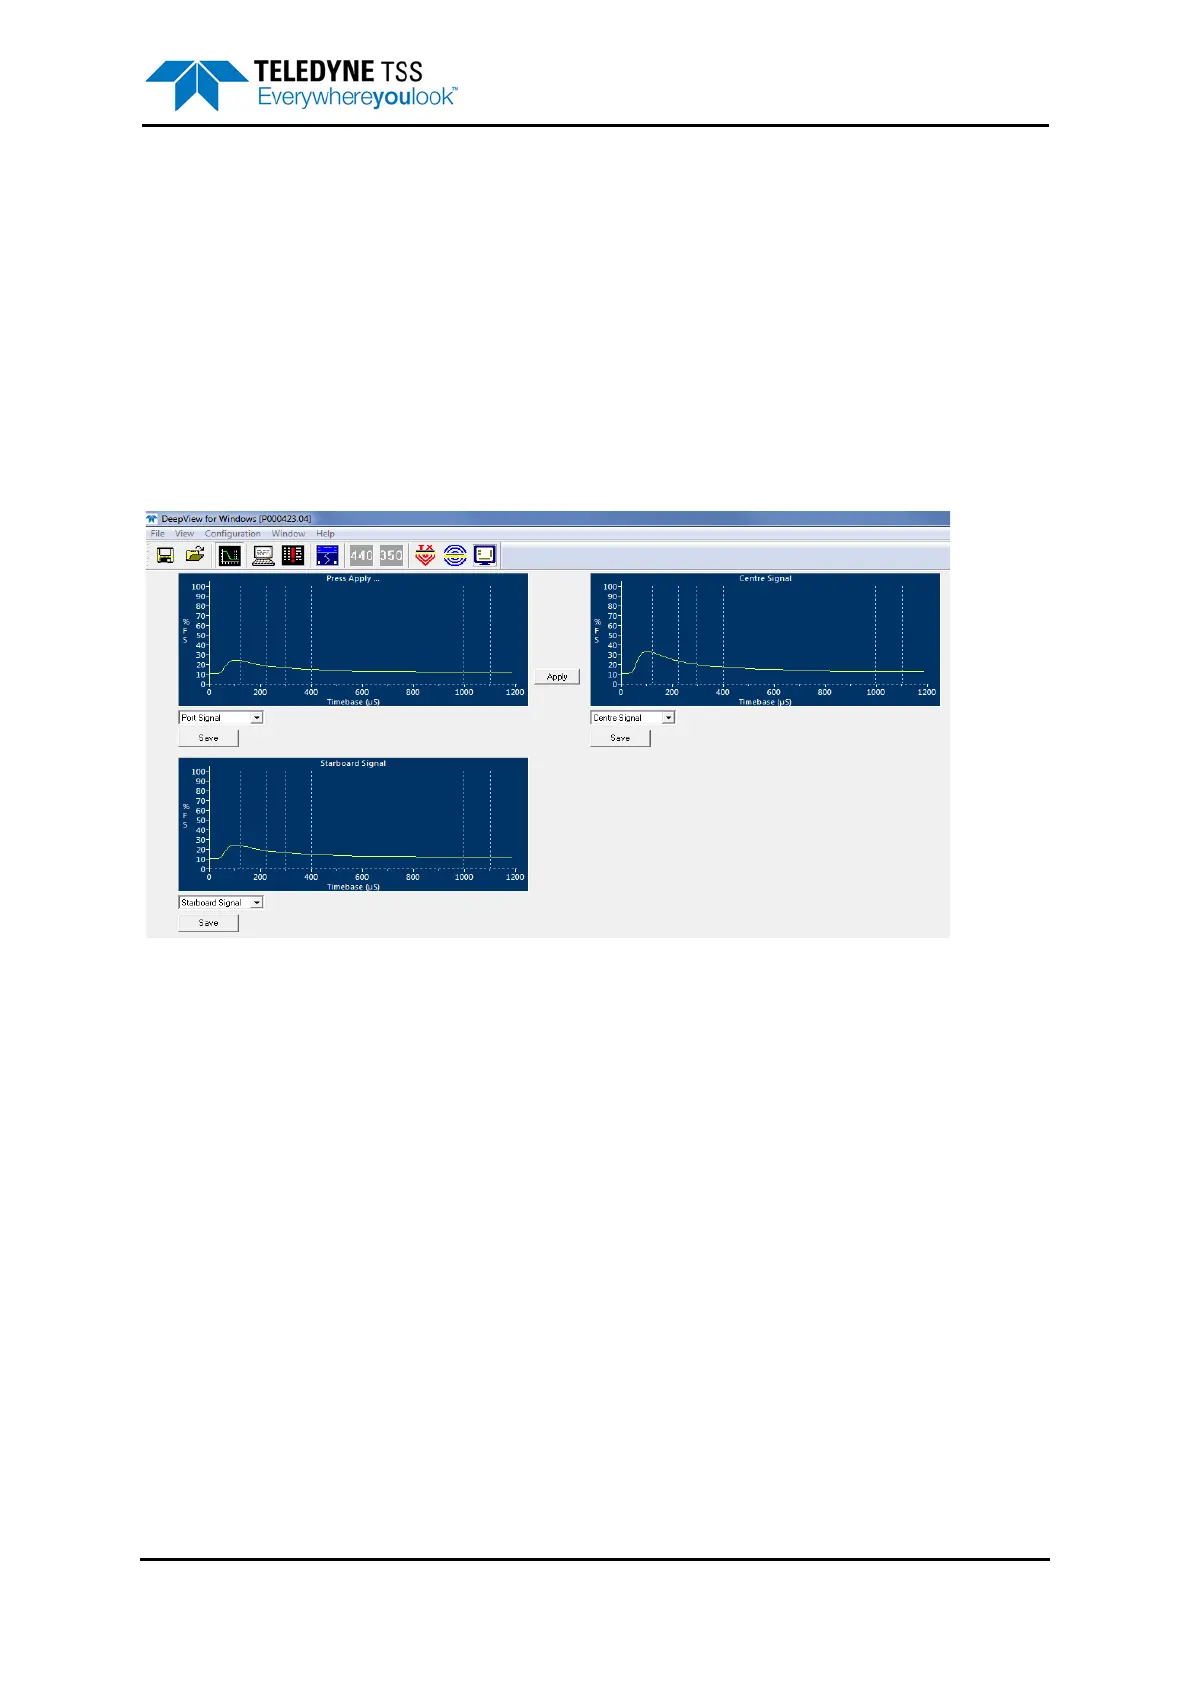
Figure 5-6: Scope Window
The above screen shows an example of the 440 Oscilloscope Window with panels for the three active
channels, Port, Centre and Starboard.
During operation each of these display panels shows the signal voltage measured on their respective
channels against a horizontal time scale and a vertical scale of percentage of full scale.
Each of the scope panels shows the three measurement windows, defined in vertical broken white
lines. These are from left to right:
❐ The early signal window, which is used in the seawater compensation algorithm
❐ The standard window, and
❐ The zero window.
As explained in this manual, the 440 System uses the difference between the average values
measured during the standard window and the zero window as the channel signal voltage. Based on
the signal voltages on the measurement channels and the target scaling factor supplied in the System
Parameters window, the system then calculates the target range from each of the coils and, from that,
determines the relative position of the target.




 To Next Page