Heracell 150i/240i 50115191_C_01-2018 109 Thermo Scientific
Chapter 7 Handling and control (iCanTM touchscreen controller)
.
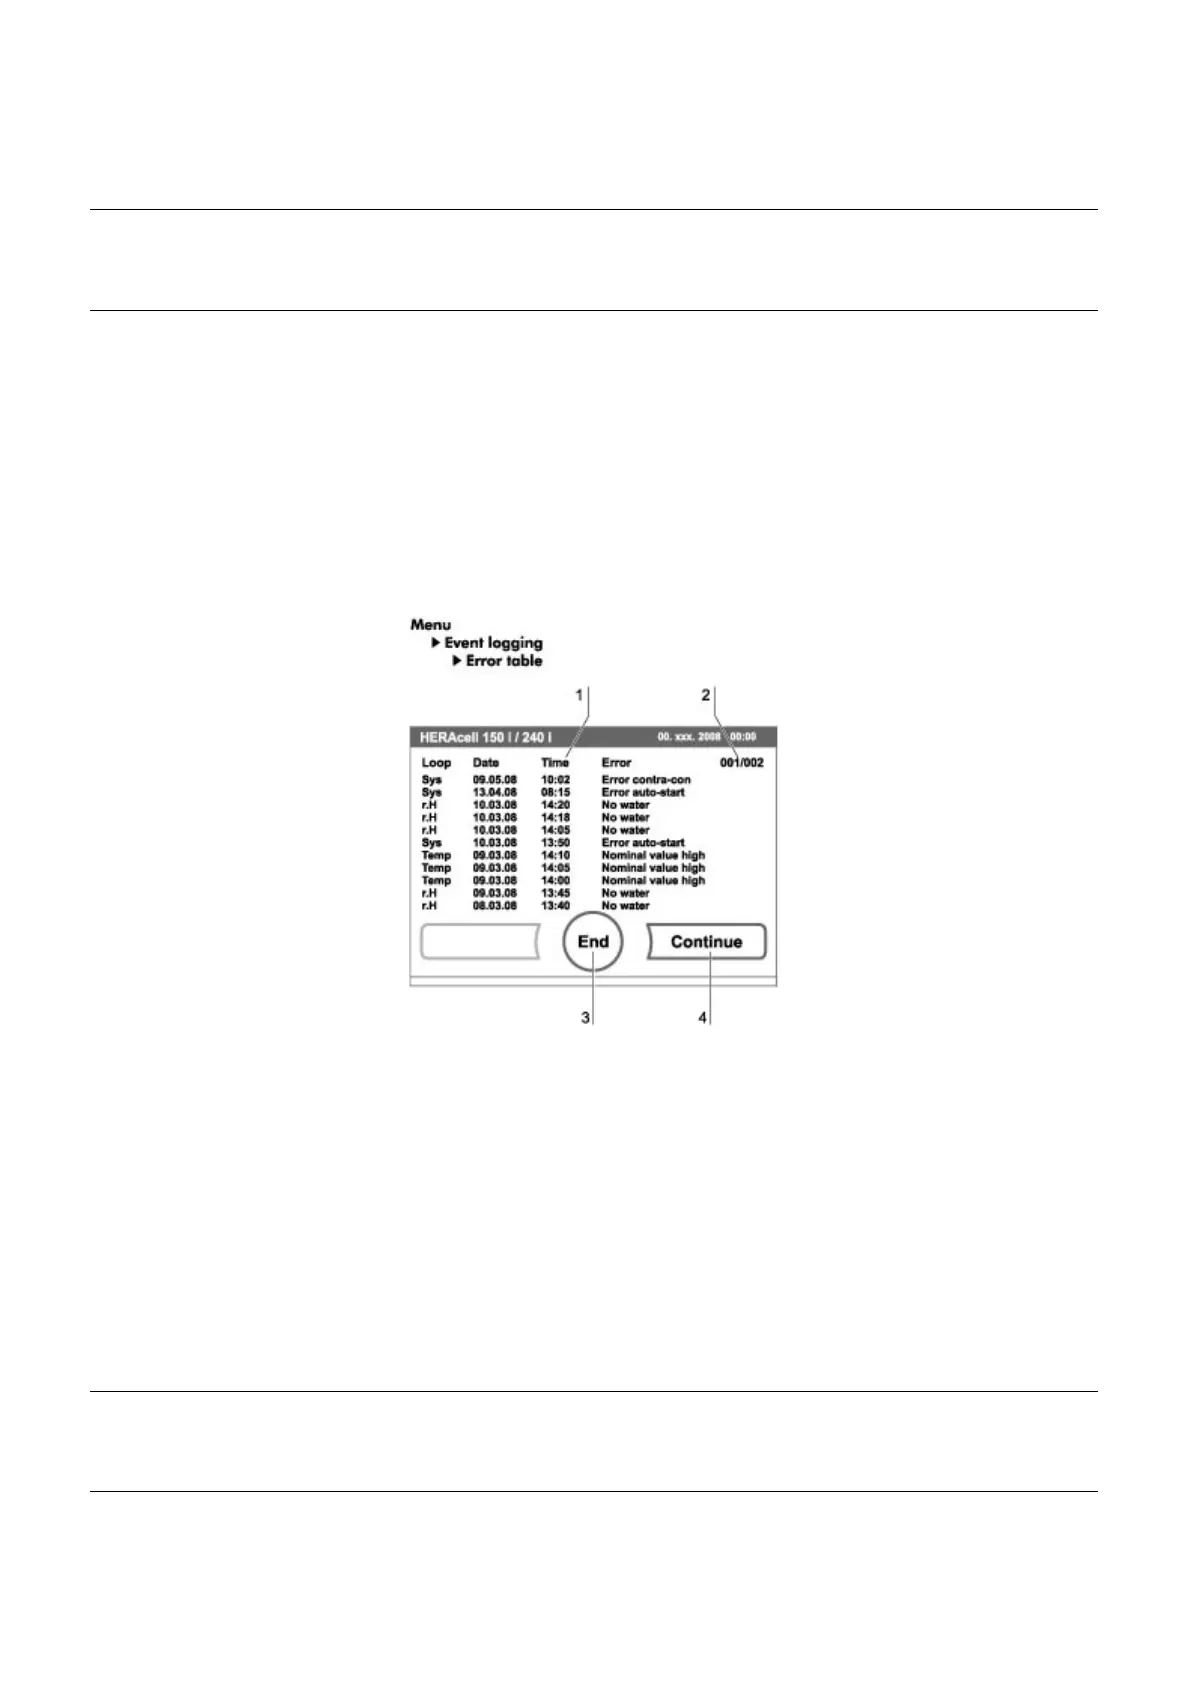
7.14.2.3. Displaying the error table:
The error table lists the errors detected by the device-integral monitoring system in descending
chronological order. The most recently detected error is listed at the top position of 22 possible
entries. An entry consists of the control loop in which the error occurred, the date, the time, and an
error description. The error table can be displayed but not edited.
If the event display consists of two pages, the user can browse through the list. The status
indicator [2] indicates which page of the two is currently being displayed.
Figure. 51. Error table display
1. To browse forward in the error table:
Press the CONTINUE key [4].
2. To browse backward in the list:
Press the PREVIOUS key.
3. To exit the display:
Press the END key [3].
The system returns to the Event Logger menu.
Note
Event logger interval time:
The logging cycle time does not affect the entries of the error table.
Note
Troubleshooting:
For a detailed overview of causes for errors and their correction, please refer to the end of this chapter!
 Loading...