39
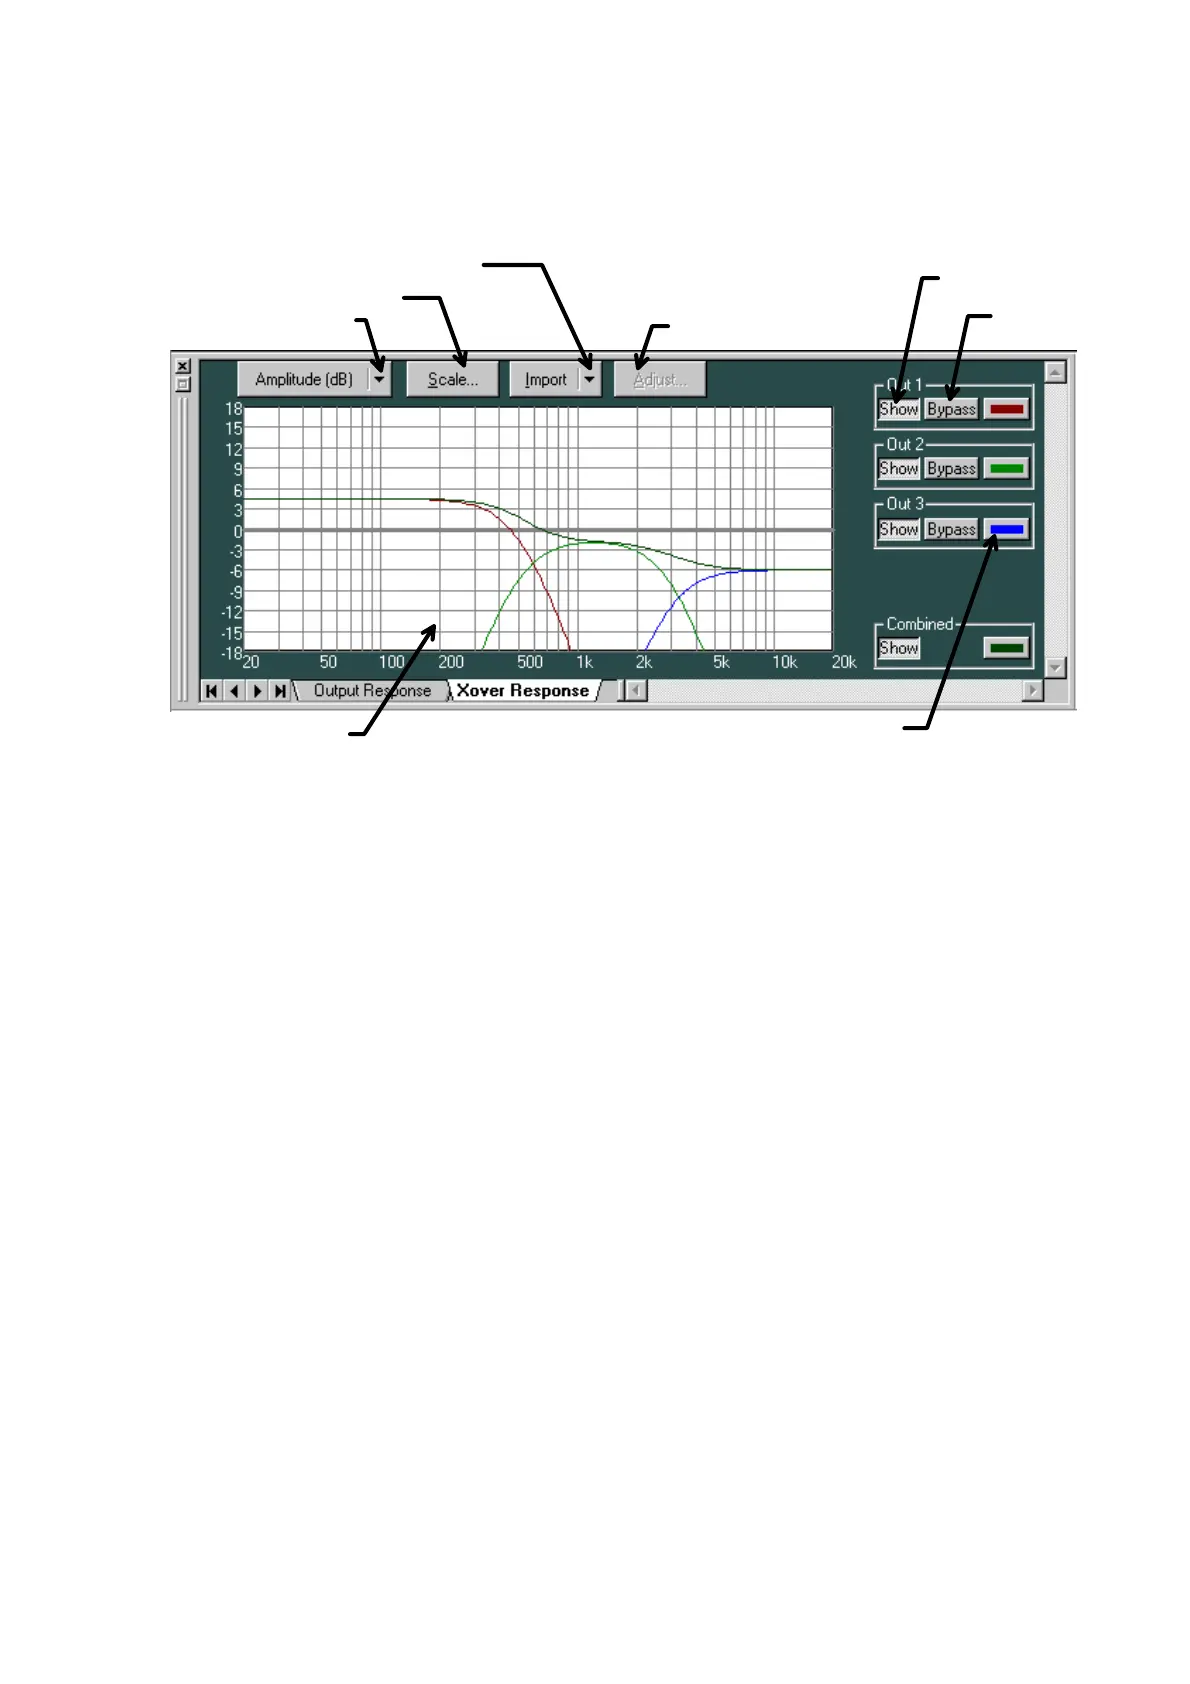
2.Xover Response
- You can display the response curves of the crossover response and the filter response following
it.
- In addition to individual channel responses, you can also display the combined response as the
result of adding them together.
- You can display three types of response: amplitude, phase and group delay characteristics.
- By importing measurement data you can conduct a simulation of a crossover setting for the
multiple-way speakers.
- The Response selection button displays the type of frequency characteristic being currently
displayed. Clicking this button enables you to make a selection from the dropdown menu. Two
display modes are available to show the characteristics: a single display of the amplitude, the
phase, or the group delay, and a dual display of their characteristics combination.
- Using the Scale-change button, you can change the graph scale of the response controller.
- To import measurement data, click the Measurement-data-import button, and then select the
target channel from the dropdown menu.
Response selection button
Scale-change button
Measurement-data-import button
Adjustment button
Response display button
Bypass button
Color-change button
Response Control
 Loading...

