38
11. Response Viewer
This section explains about the Response Viewer.
To show or hide the Response Viewer, select from the menu bar View
→ Response View or click
in the PEQ/GEQ/Filter/Xover viewer.
The Response Viewer features the Output Response and the Xover Response.
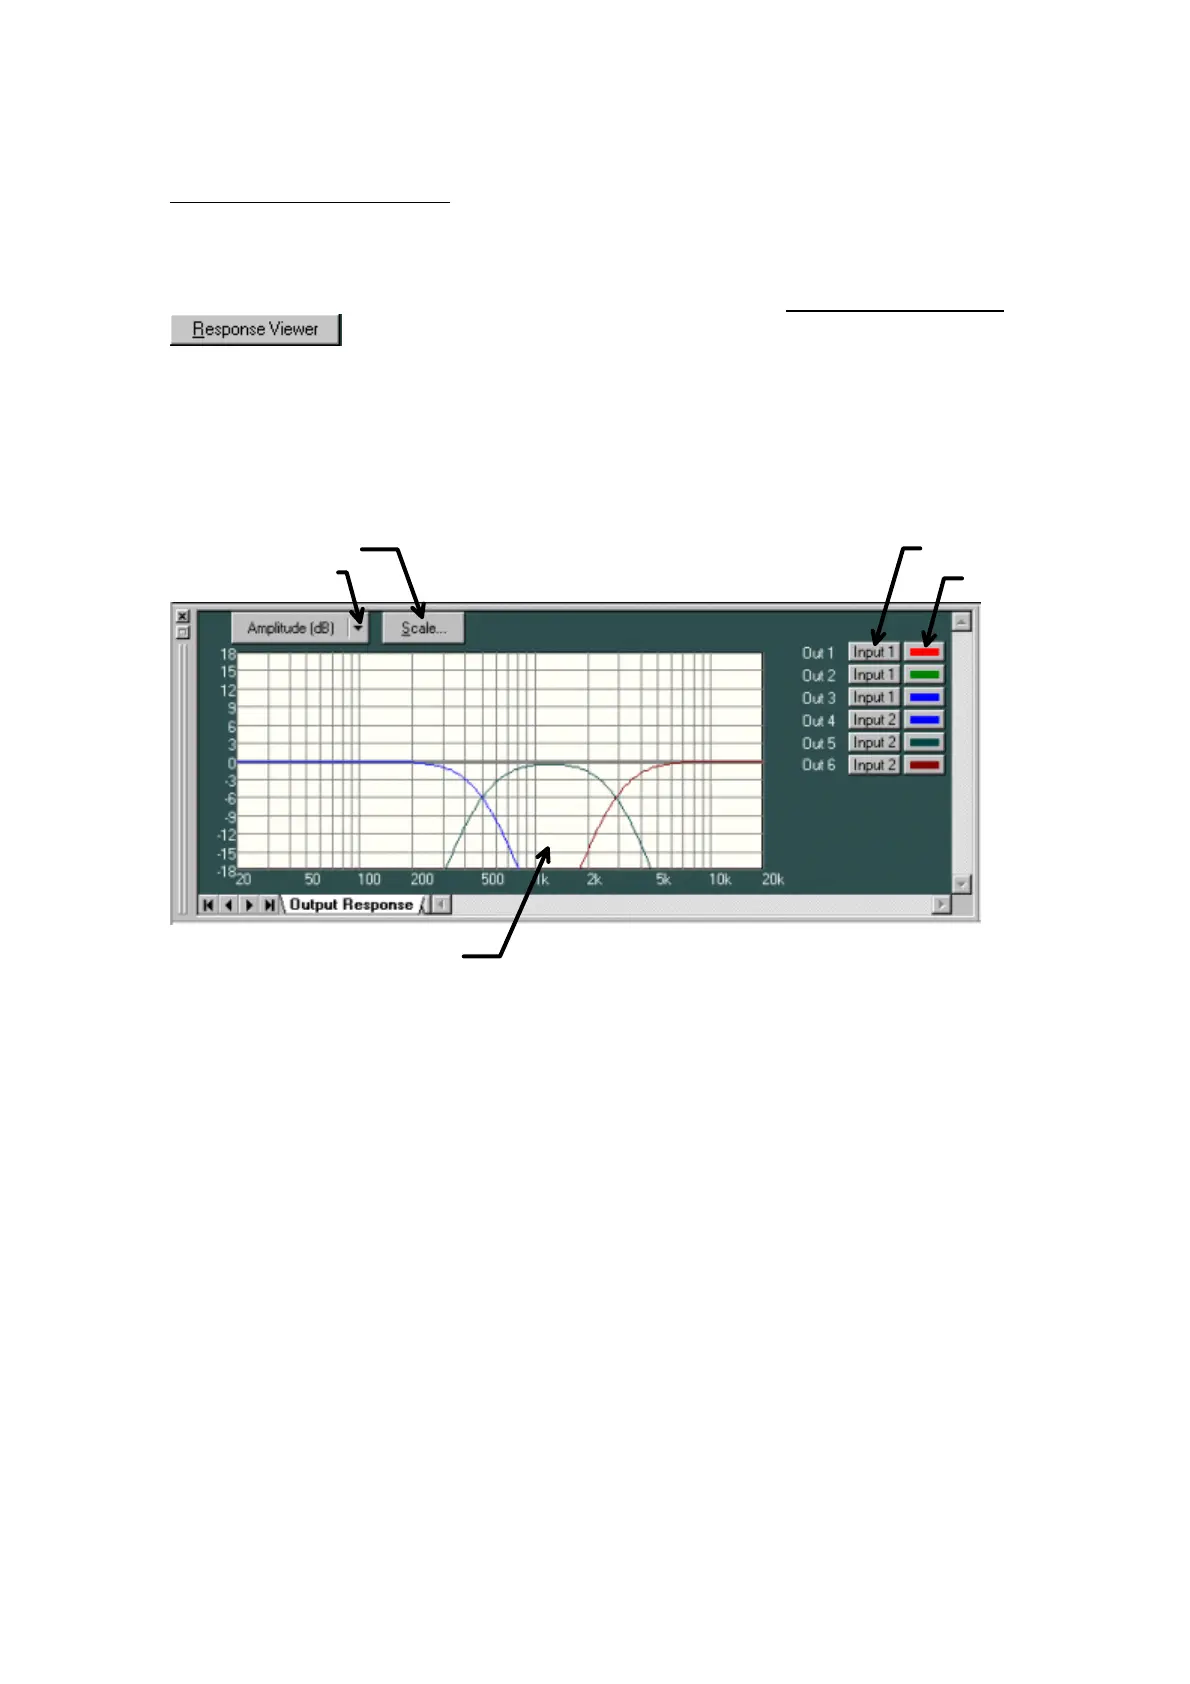
1.Output Response
- You can display the total response from the input to the output.
- For each output channel, you can select the input to which the matrix sets the routing.
- You can display three types of response: amplitude, phase and group delay characteristics.
- The Response selection button displays the type of frequency characteristics being currently
displayed. Clicking this button enables you to make a selection from the dropdown menu. Two
display modes are available to show the characteristics: a single display of the amplitude, the
phase, or the group delay, and a dual display of their characteristics combination.
- Using the Scale-change button, you can change the graph scale of the response controller.
- Using the Input selection button, you can turn on/off the response display for each output
channel, and select input channels.
- Using the Color-change button, you can change the color of the response curves of each
channel.
Response selection button
Scale-change button
Input selection button
Color-change button
Response Control