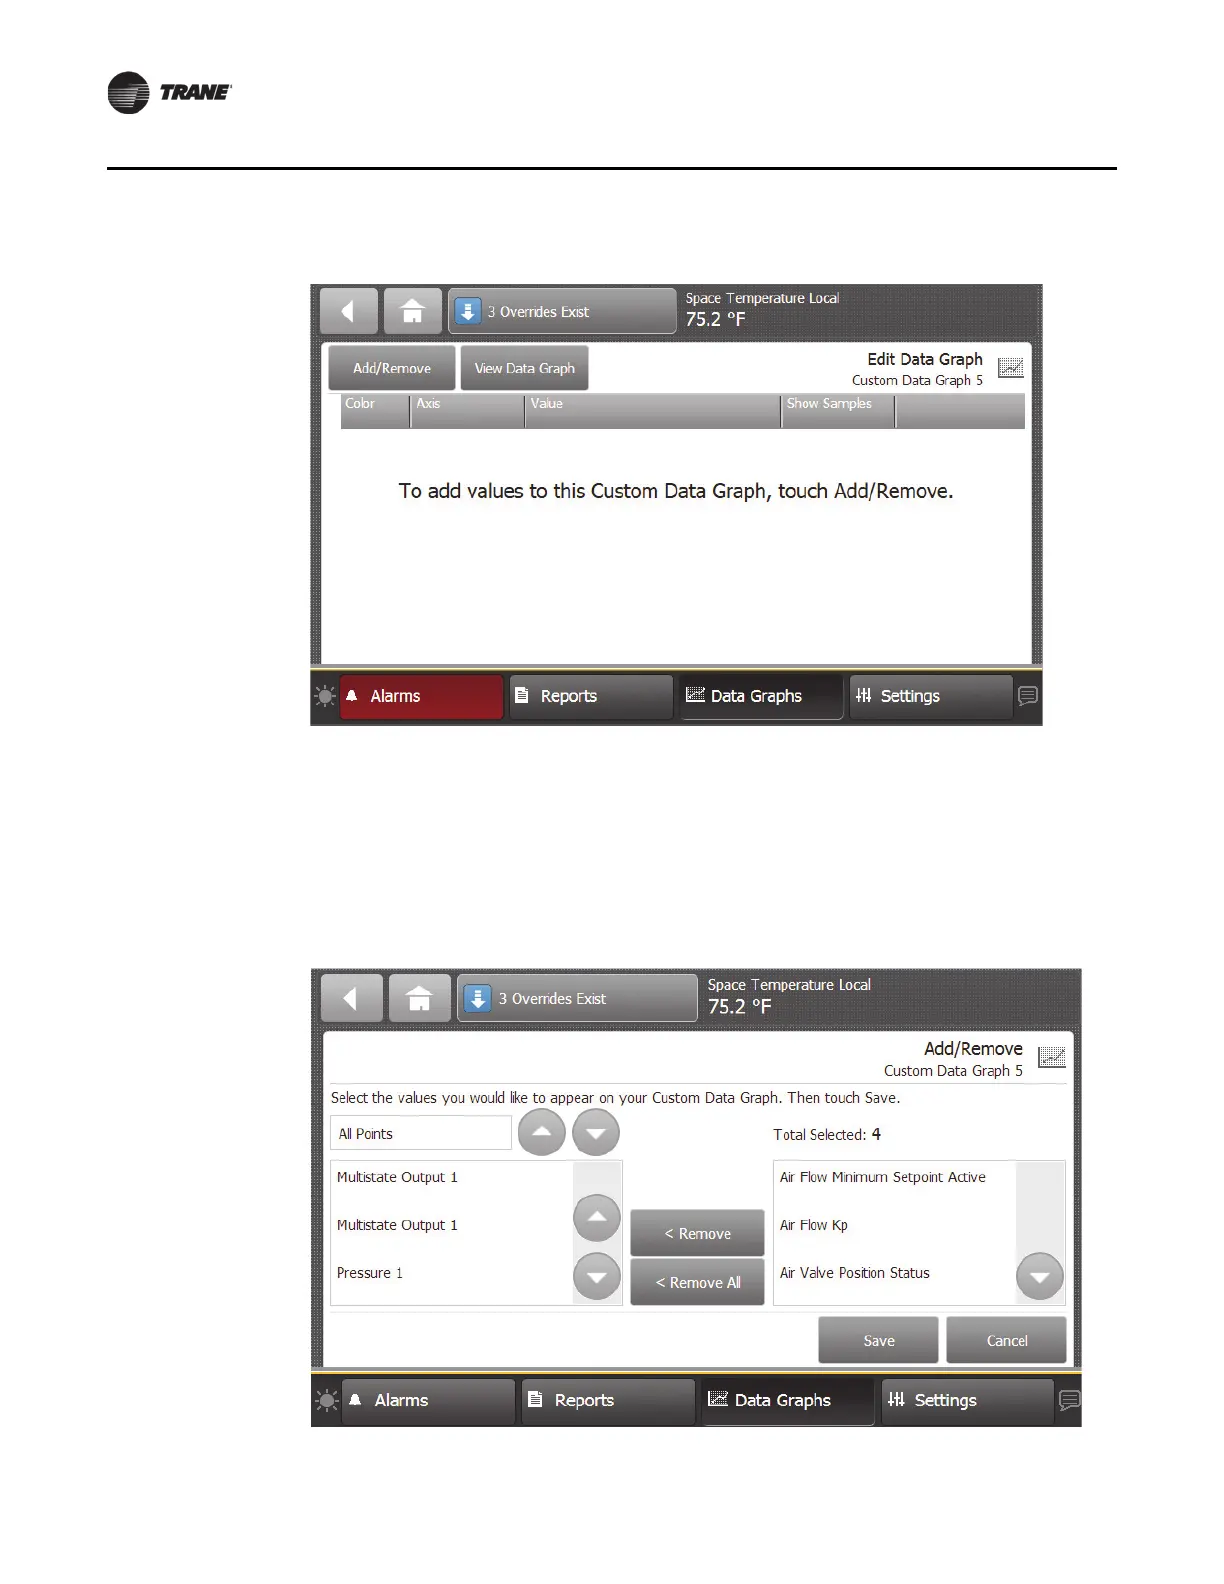
Figure 29. Edit Data Graph screen
40 BAS-SVX50F-EN
Data Graphs
5. Touch the Add/Remove button to add values to the custom data graph.
The Add/Remove screen appears.
6. Use the arrow buttons to select a datalog type: analog, binary,
or multistate, which then
populates the box directly below (Figure 30).
7. Select the values, then touch the Add button (up to four selectio
ns are allowed).
8. Touch the Save button.
The Edit Data Graph screen appears, which reflects the selected values.
Figure 30. Adding data logs to the custom graph
 Loading...