Appendix D: Software
Data Finder and Quick Reports
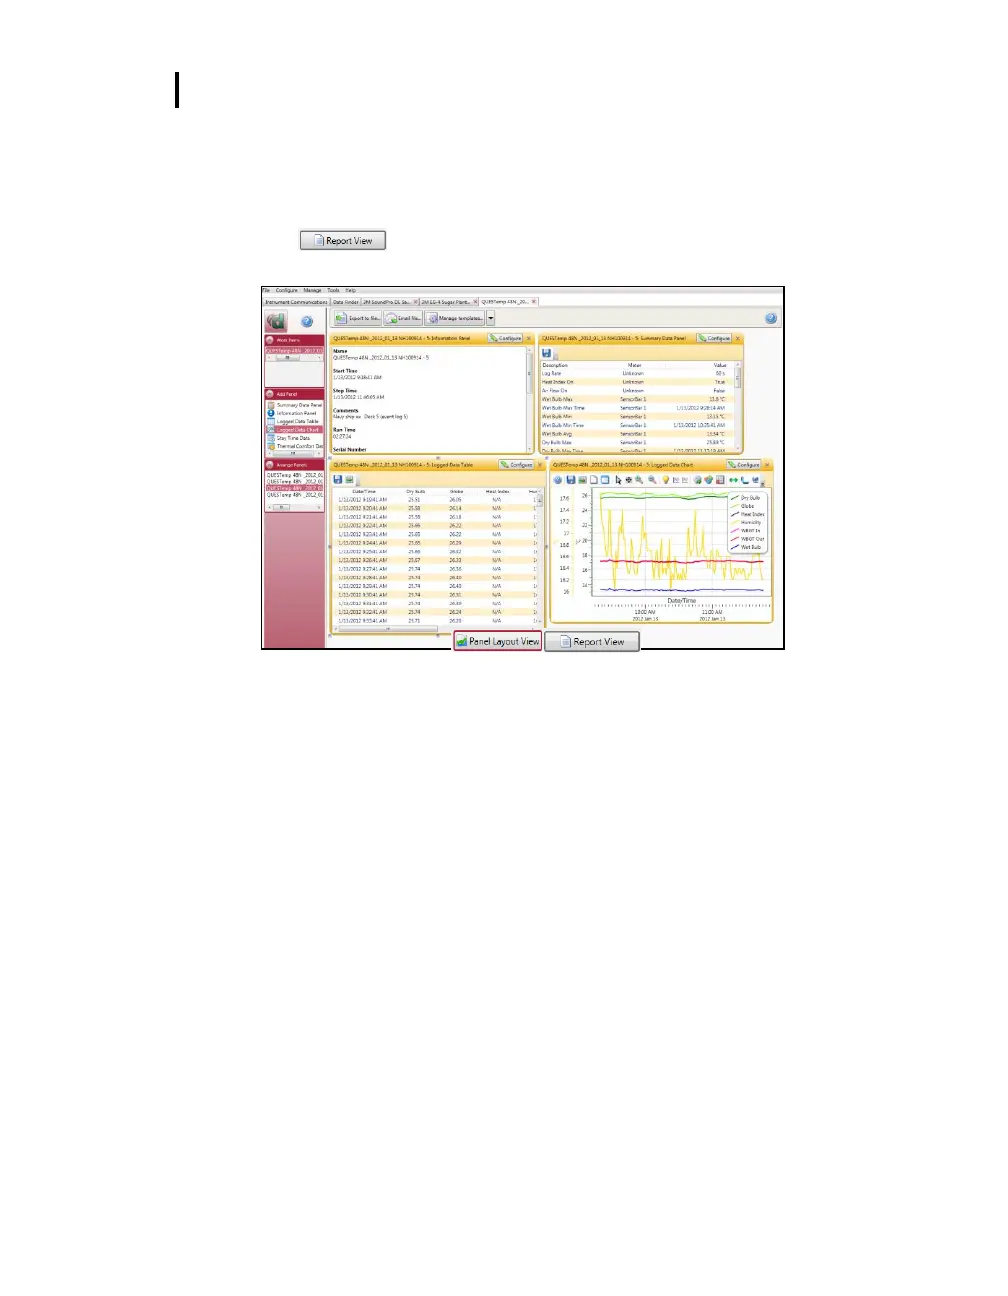
Analyze: allows you to add charts/graphs and customize how they will appear in a
report. Tip: Add the panels by using the add a panel and dragging them into the
appropriate location.
Press button and it will generate a report based on the where the
charts/graphs (panels) are placed.
Figure 1-36: Analyze button opens to the panel layout page