LabQuest
®
App
24
Analyzing Data from the Graph Screen
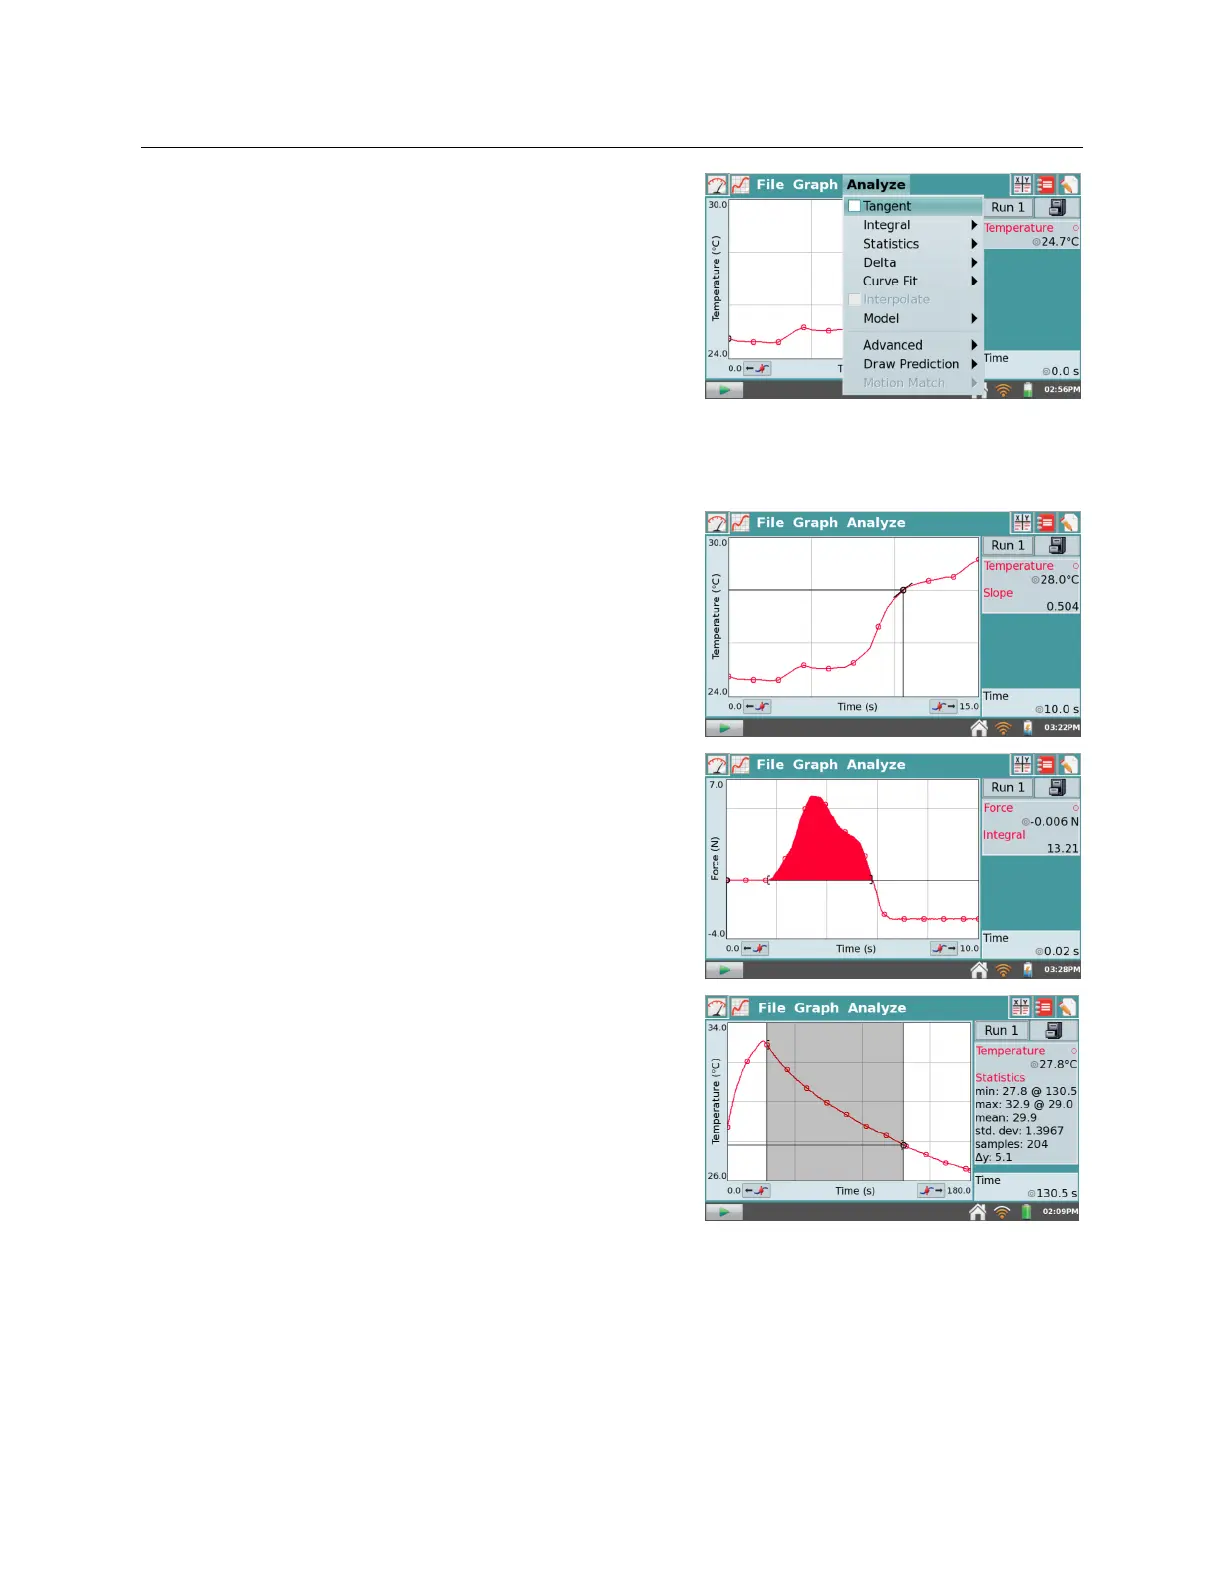
The Analyze menu on the Graph Screen gives you
access to additional tools such as tangent lines,
integrals, statistics, and curve fits. To apply one of
these tools, choose the desired tool from the Analyze
menu. If prompted, select the desired column.
Upon enabling an analysis tool, a summary of analysis
information is displayed in a panel to the right of the
graph. Scroll arrows will appear, if needed. You can
tap the summary to display the values on a detail dialog
for ease of reading.
The following analysis tools are available from the
Analyze menu.
Tangent – The Tangent mode enhances the
Examine cursor by adding a tangent line and
numeric display of the slope as you tap different
locations on the graph.
Integral – The Integral tool numerically integrates
graphed data. Select a region, if needed, and choose
Integral from the Analyze menu. Enable the tool by
tapping on the displayed sensor or column name.
The integral is drawn and the numeric result is
displayed in a panel to the right of the graph.
Statistics – The Statistics tool displays statistics for
graphed data. Select a region, if needed, and choose
Statistics from the Analyze menu. Enable the tool
by tapping on the displayed sensor or column
name. Descriptive statistics are displayed in a panel
to the right of the graph. If a region is selected,
brackets are drawn to indicate the region used for
calculations.