pg | 47
Spot Sampling
View Live Data
When connecting through the Handheld, KOR soware attempts to automatically connect to an available
sonde and start displaying current data in a live view. To manually access the live view from either the
Handheld or Desktop, go to the Run menu and choose “Dashboard.” Users can set view preference in the live
view menu to display numeric live data (default) or a graph view, where a maximum of two parameters can
simultaneously be plotted on the screen. For overview of KOR menus, see section 4; for overview of Handheld
keypad functions, see section 1.3
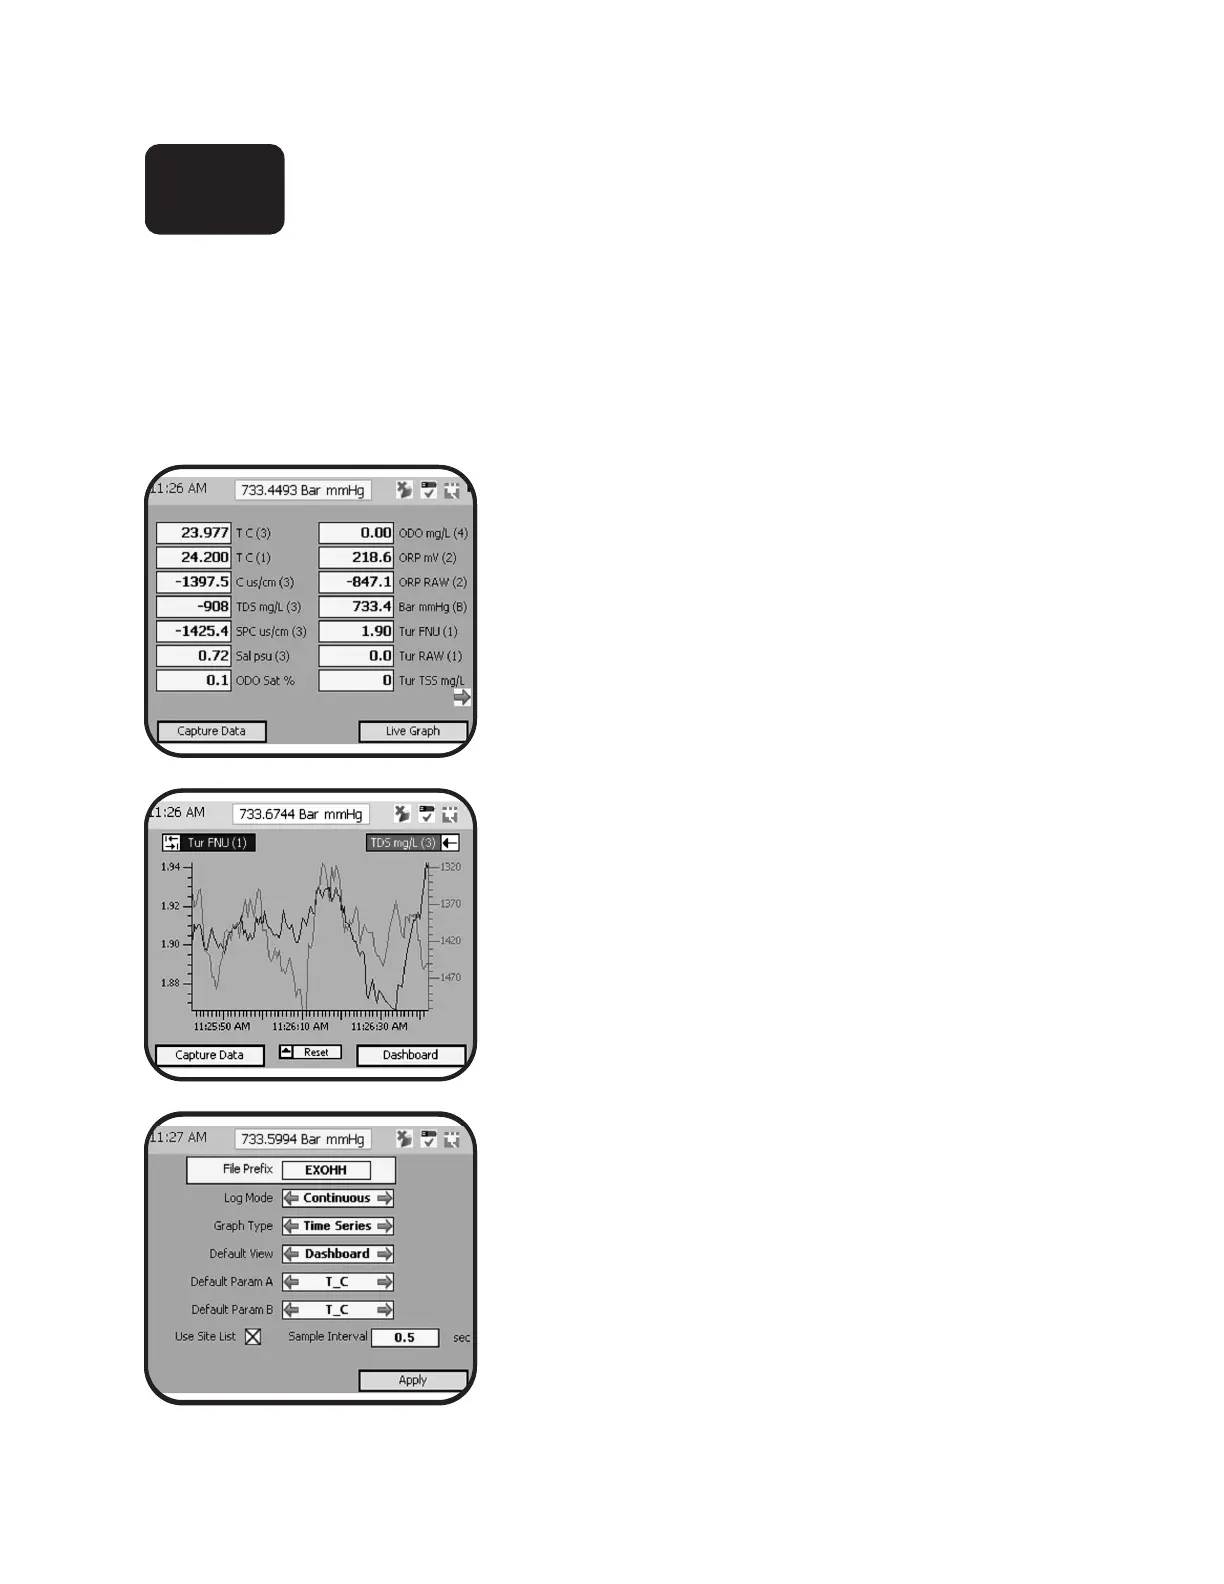
Data dashboard and graph
Users can toggle between numeric dashboard and live
graph views using a so key. e other so key may be used
to log information displayed on the screen.
Dashboard image at le; live graph image at middle le.
Parameter preference
Users can select which parameters to display in both graph
and dashboard modes by using the backspace and tab keys
on the Handheld keypad. If an expected parameter is not
available, rst set the appropriate units preference from the
Options | Units menu.
Advanced display settings
Adjust data display settings for both dashboard and live
graph modes in the Run menu. Select Settings to change
the settings for log mode (up to 100 points), graph type
(time series or vertical prole), sample interval (default is 1
sec), and default parameters to view.
3.5
 Loading...