11-14
IM WT5000-01EN
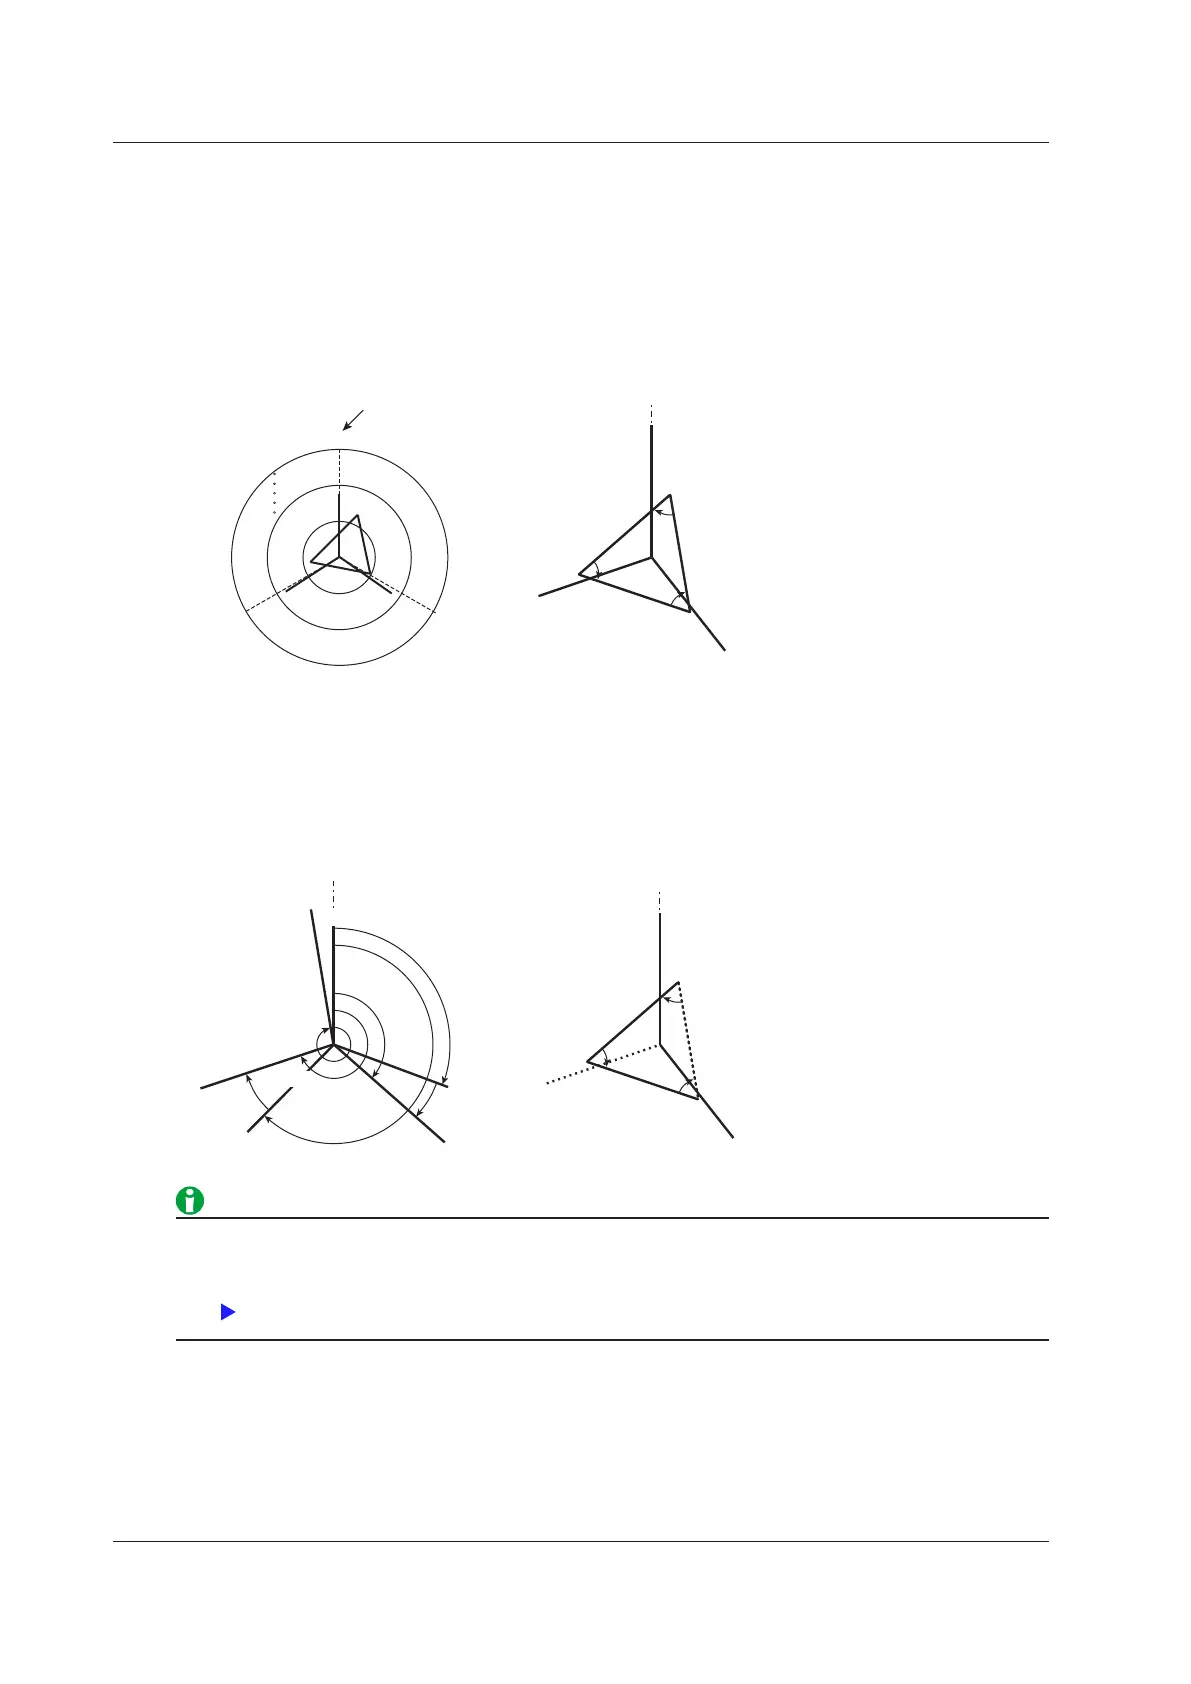
Vector Display (Vector)
You can select a wiring unit to display vectors of the phase differences and amplitudes (rms values) of the
fundamental signals, U(1) and I(1), in each element in the unit. The positive vertical axis is set to zero (angle
zero), and the vector of each input signal is displayed.
Vector Display Example
For a 3P3W system with a three-voltage three-current method
• U1(1), U2(1), and U3(1) are line voltages.
• I1(1), I2(1), and I3(1) are line currents.
I1(1)
I3(1)
O
U1(1)
U3(1)
U2(1)
ΦU1-U2
ΦU2-U3
ΦU3-U1
Size of the peripheral circle (range)
U1(1) 102.60 V
I1(1) 3.5237 A
P1(1) 0.3562kW
S1(1) 0.3615kVA
Q1(1) -0.0618kvar
λ1(1) 0.9853
U2(1) 101.45 V
I2(1) 3.5090 A
P2(1) 0.5542kW
S2(1) 0.6016kVA
Q2(1) 0.2342kvar
λ2(1) 0.9211
U3(1) 101.40 V
I3(1) 3.4990 A
P3(1)
-0.2128kW
-0.5067kvar
1) -0.3549
ΣA = 3P3W(3V3A)
PLL Src = U1
fPLL1 = 743.00 Hz
ΦU1
-U2 = 57.67
-U3 = 302.78
-I1 = 315.35
-I2 = 22.91
-I3 = 249.22
300.0 V
6.000 A
For a 3P4W (three-phase four-wire
system)
• U1(1), U2(1), and U3(1) are phase
voltages.
• I1(1), I2(1), and I3(1) are line
currents.
For a 3P3W (three-phase three-wire
system)
• U1(1), U2(1), and U3(1) are line
voltages.
• I1(1), I2(1), and I3(1) are line
currents.
However, U3(1) and I3(1) are not
actually measured for the 3P3W
system. The vectors are displayed
through computation.
Φ2(1)
Φ1(1),
ΦU1-I1
Φ3(1)
ΦU1-U3
ΦU1-I2
U1(1)
I1(1)
U3(1)
U2(1)
ΦU1-U2
ΦU1-I3
I1(1)
I3(1)
I2(1)
O
U1(1)
U3(1)
U2(1)
ΦU1-U2
ΦU2-U3
ΦU3-U1
If the analysis window width (number of cycles of the fundamental signal) that is determined by the
fundamental frequency is shorter than the data update interval, vectors are not displayed. Set a longer data
update interval. For details, see "Notes about the Numeric Data Display."
Display Group (Group)
Select the group you want to display from 1 to 4.
To assign waveforms to each group (1 to 4), set the displayed item (Vector).
11 Graph Display
 Loading...