Combustion Oxygen Monitor
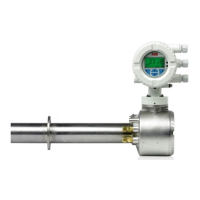
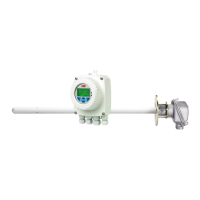
Endura AZ20 Series Probe 4 Troubleshooting – Functional Checks
10 IM/AZ20M–EN Rev. B
4.3 Checking Cell Output Voltage
In the following checks, test gas is applied to the probe and the cell output is measured to check if the cell is functioning to theoretical
values in isolation from any associated transmitter.
The check can be performed using 1 test gas (for a functional check) or 2 test gases (for a detailed cell accuracy check). Using 2 test
gases provides the most accurate result – both checks refer to the graph in Fig. 4.3:
Ambient Temp.
°C (°F)
Millivolts Ambient Temp.
°C (°F)
Millivolts Ambient Temp.
°C (°F)
Millivolts Ambient Temp.
°C (°F)
Millivolts
50 (122) 27.106 24 (75.2) 28.168 37 (98.6) 27.639 11 (51.8) 28.691
49 (120.2) 27.147 23 (73.4) 28.209 36 (96.8) 27.68 10 (50) 28.731
48 (118.4) 27.188 22 (71.6) 28.249 35 (95) 27.721 9 (48.2) 28.771
47 (116.6) 27.229 21 (69.8) 28.29 34 (93.2) 27.762 8 (46.4) 28.811
46 (114.8) 27.27 20 (68) 28.33 33 (91.4) 28.803 7 (44.6) 28.851
45 (113) 27.311 19 (66.2) 28.37 32 (89.6) 28.843 6 (42.8) 28.89
44 (111.2) 27.352 18 (64.4) 28.41 31 (87.8) 28.884 5 (41) 28.93
43 (109.4) 27.394 17 (62.6) 28.451 30 (86) 27.925 4 (39.2) 28.97
42 (107.6) 27.435 16 (60.8) 28.491 29 (84.2) 27.966 3 (37.4) 29.009
41 (105.8) 27.476 15 (59) 28.531 28 (82.4) 28.006 2 (35.6) 29.049
40 (104) 27.527 14 (57.2) 28.571 27 (80.6) 28.047 1 (33.8) 29.089
39 (102.2) 27.558 13 (55.4) 28.611 26 (78.8) 28.087 0 (32) 29.128
38 (100.4) 27.599 12 (53.6) 28.651 25 (77) 28.128
Table 4.1 Thermocouple v Ambient Temperature for Flue Temperatures up to 700 °C (1292 °F)
Fig. 4.3 Cell Output v Percentage Oxygen
110
100
90
80
70
60
50
40
30
20
10
0
3.7
6
0.1 0.2 0.5 1 2 5 10 20 25
3.7
Cell Output (Span mV)
Output (Volume) %
 Loading...