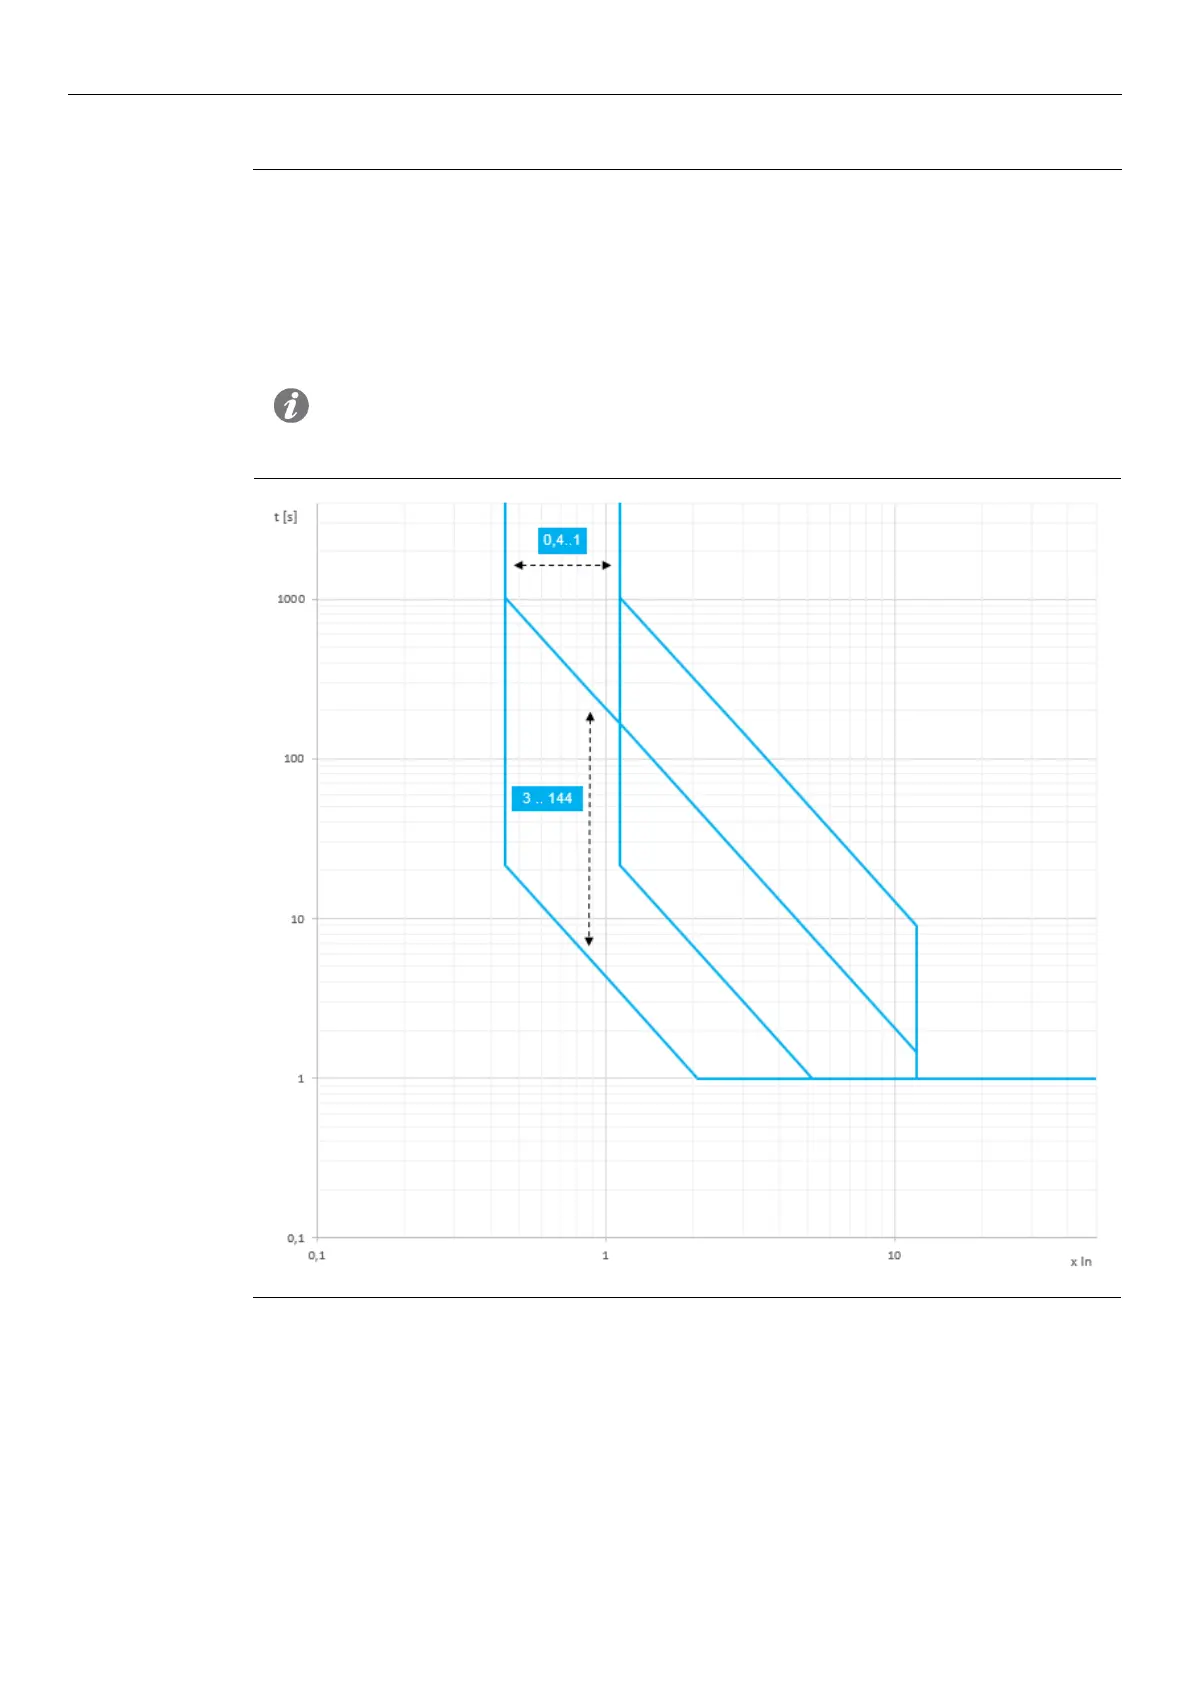
This chapter includes the tripping curves of the protections, represented in different point graphs:
The curves are represented considering the maximum and minimum values of the
parameters of each protection.
The protections that have multiple curves (e.g., protection S), are represented in multiple
charts.
The curves do not take into account the effects of special parameters like thermal memory
and startups.
NOTES: to calculate the trip time it is recommended to always use the mathematical
function in the protections summary table (page 78)