ABEM Terraloc Pro 2
66
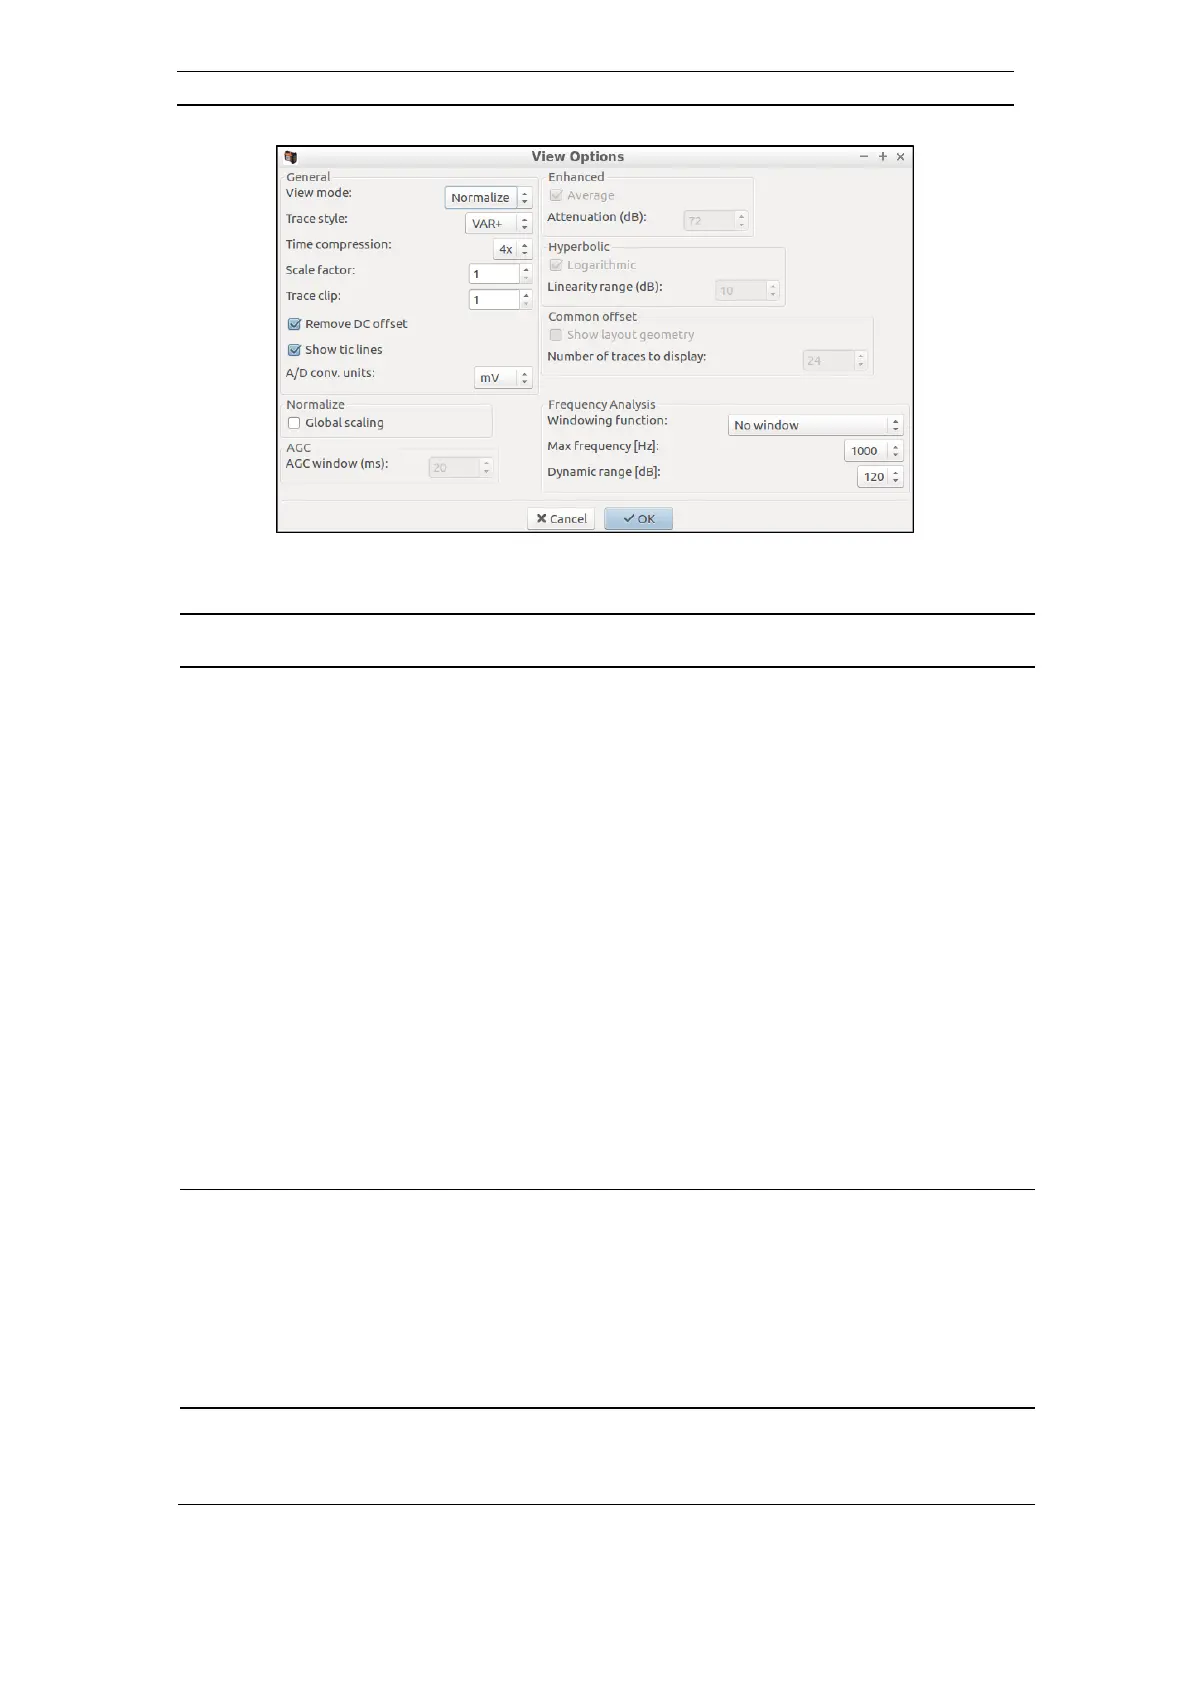
Figure 57 The View Options Dialog
- The view mode determines how data is scaled for the display. The
following modes are available:
The data is not scaled, but the amplitudes are used
directly. It is, however, possible to attenuate the
displayed signals using the enhanced attenuation
parameter
The max value in each trace is used to scale all samples
in the trace. See also global scaling
Uses the average amplitude calculated from a running
window (which length is specified by the AGC window
parameter). This means that each sample is scaled
according to the average signal level in the samples
vicinity
Applies a hyperbolic scaling to the data. If the
logarithmic choice is selected, the function ArcSinH will
be used, otherwise the function TanH is used
- The following styles are available:
This is a wiggle trace with the positive side filled-in
This is a wiggle trace with the negative side filled-in
The trace is plotted as a wiggle
Each sample value is plotted as a dot
- Selects compression in time. This makes more of the record visible.
Available values are:
1x, 2x, 4x and 8x