98
1.
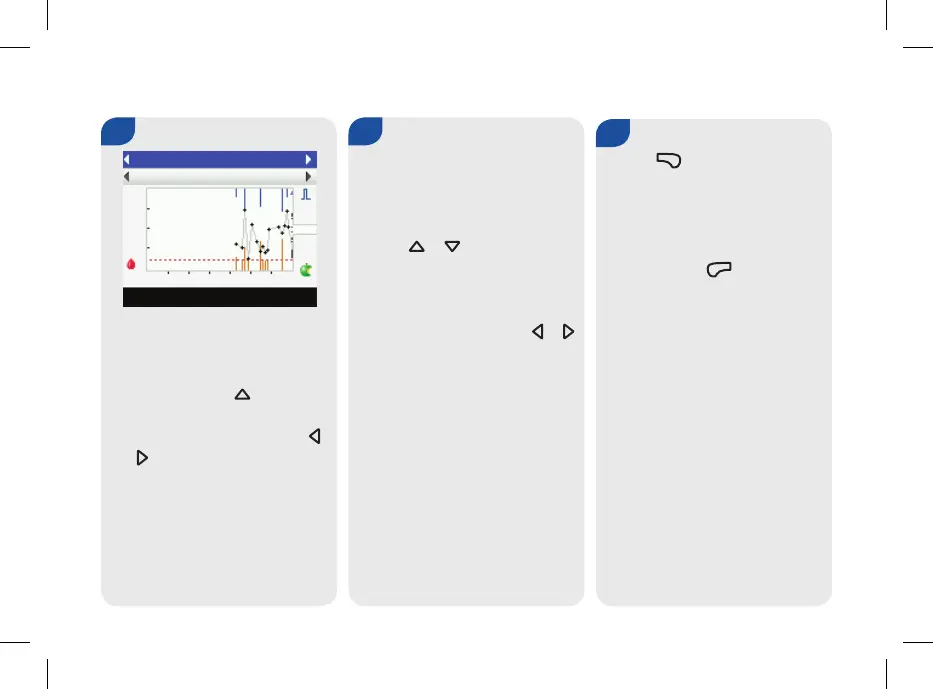
j To display a trend graph for
another time range (last
8 hours, 24 hours, 48 hours,
or 7 days), press x to highlight
the time range selection eld
(top of screen). Press either <
or > until you reach the time
range you need.
2.
j To display a trend graph for
another meal time selection
(Overall, Pre Meal, Post Meal,
Bedtime, or Other), press
either x or z to highlight
the meal time selection eld
(immediately below the time
range which is at the top of
the screen). Press either < or >
until you reach the meal time
selection you need.
Trend Graph
 Loading...