135
Checking your meter
7
Immediately after the result is displayed:
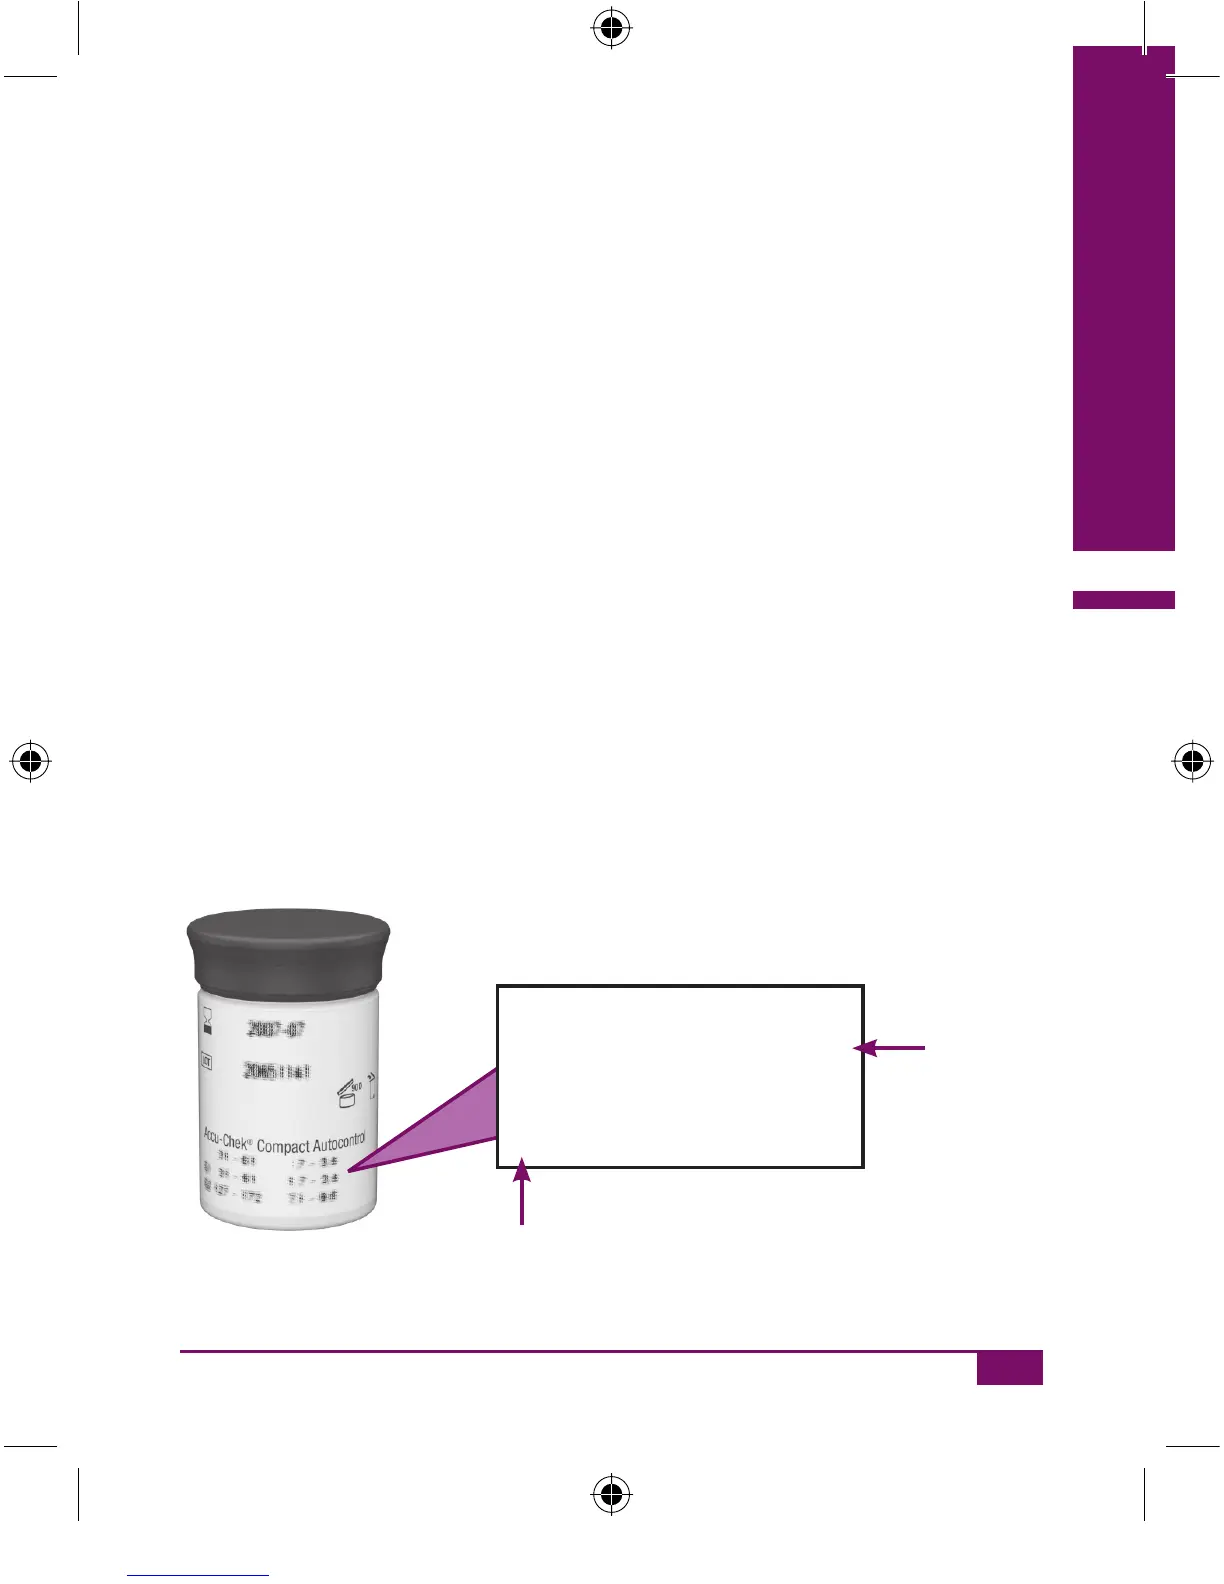
Compare the result with the concentration table printed on the peel-
off label attached to the drum container.
The result must be within the concentration range stated.
The concentration table has two rows and two columns. Rows 1 and 2
contain concentration data for the two different control solutions, G1
and G2; the columns are for the two different units of measurement,
mmol/L and mg/dL.
Make sure you compare the result with the concentration data stated for
the control solution you used and the unit of measurement your meter
displays.
Accu-Chek
®
Compact Autocontrol
mmol/L mg/dL
G1 1.7-3.4 31-61
G2 7.1-9.6 127-172
Unit of
measurement
The figures shown are for
illustration only
Control
solution used
AC_CP_LCM_Manual_EN-UK final.indd 135_CP_LCM_Manual_EN-UK final.indd 135 20.6.2007 11:04:3120.6.2007 11:04:31
 Loading...