13
- The cooling capacity and absorbed
power correction factors consider
the presence of glycol and the
different evaporation temperature.
- The correction factor of the
pressure loss considers the
different capacity deriving from the
application of the water flow rate
correction factor.
- The water flow rate correction
factor is calculated in a way to
maintain the same ∆t that would be
present in the absence of glycol.
NOTE
To ease reading of the graphs, there is
an example on the following page.
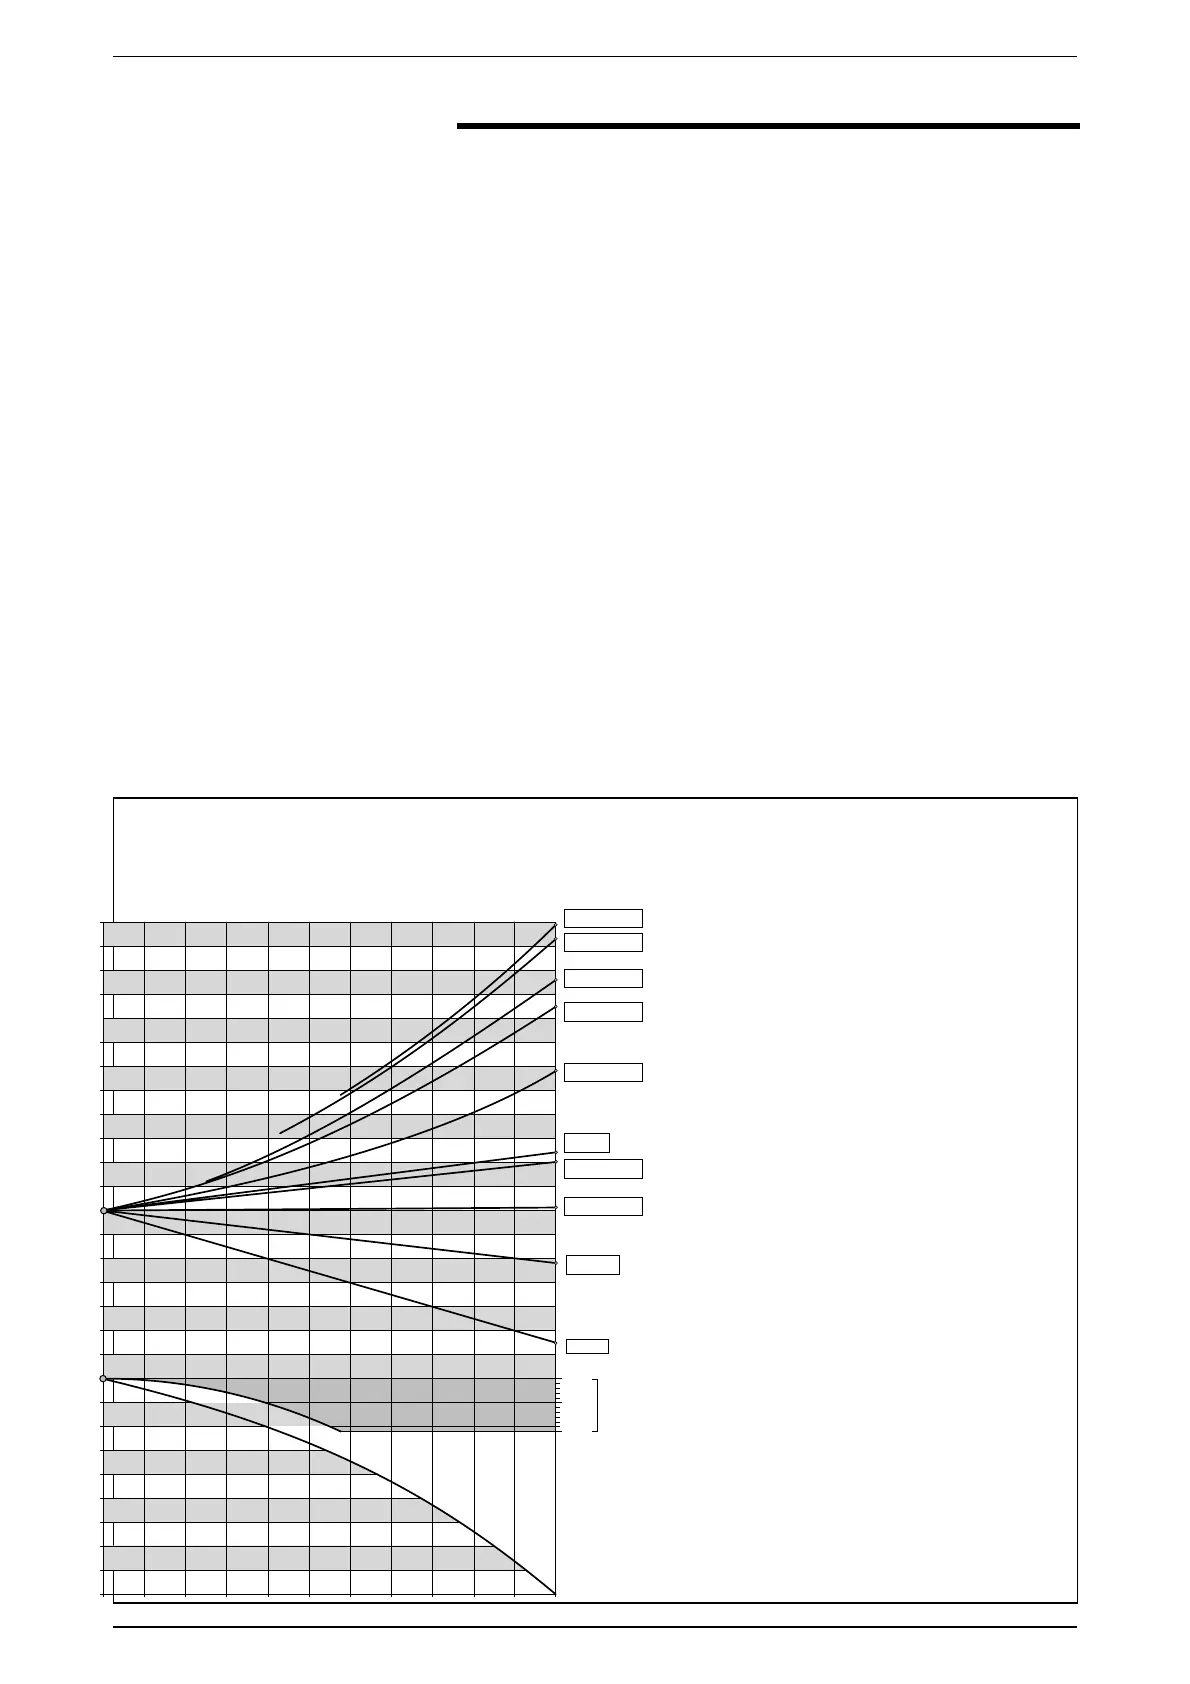
Using the diagram below it is possible
to establish the percentage of glycol
necessary; this percentage can be
calculated by taking the following
factors into consideration:
On the basis of the fluid considered
(water or air), the graphics must be
entered from the left or right. From
the intersection between the external
air temperature or produced water
temperature lines and the relative
curves, a point is obtained through
which the vertical line must pass
that identifies both the percentage
of glycol and the relative corrective
co-efficients.
8.1 HOW TO READ THE GLYCOL
CURVES
The curves shown in the figure
summarise a large amount of
data, each of which is represented
by a specific curve. In order to use
these curves correctly several initial
considerations must be made:
- If the percentage of glycol on the
basis of the external air temperature
is to be calculated, enter from
the left axis and once the curve is
intersected, trace a vertical line,
which will then intercept all of the
other curves; the points obtained
from the upper curves represent the
co-efficients for the correction of the
cooling capacity and absorbed power,
the flow rates and pressure drops
(remember that these co-efficients
must however be multiplied by the
nominal value of the measurement
being examined); while the lower axis
recommends the percentage value
of glycol necessary on the basis of
the temperature of the external air
considered.
- If the percentage of glycol is to
be calculated on the basis of the
temperature of the water produced,
enter from the right axis and once
the curve has been intersected,
trace a vertical line, which will then
intercept all of the other curves;
the points obtained from the upper
curves represent the co-efficients
for the cooling capacity and
absorbed power, for flow rates and
pressure drops (remember that
these co-efficients must however
be multiplied by the nominal value of
the measurement being examined);
8 ETHYLENE GLYCOL SOLUTION
~
~
~
~
~
~
~
~
~
~~
~
¤
¤~
¤~
¤
¤
¤
¤
¤
~ ~
¤
=[>G^
=[>GY
=[>G^Û¨G\:©
=[>HÛ¨G\:©
=[>;h=Û¨]©
=[>;h=Û¨\©
=[>;h=Û¨[©
=[>;h=Û¨Z©
=[>;h=Û¨Y©
=[>H=
K]eh]jYlmjYÛ
Y[imYÛhjg\gllYÛµ:
=Yllgj]Û[gjj]llang
K]eh]jYlmjYÛYjaYÛ]kl]jfYÛµ:
KEY:
FcGPf Correction factor of the
cooling capacity
FcGPa Correction factor of the
absorbed power
FcGDpF (a) Co rr ection factor of
the pressure drops
(evaporator) (average
temp. = -3.5 °C)
FcGDpF (b) Correction factor of the
pressure drops (average
temperature = 0.5 °C)
FcGDpF (c) Correction factor of the
pressure drops (average
temperature = 5.5 °C)
FcGDpF (d) Correction factor of the
pressure drops (average
temperature = 9.5 °C)
FcGDpF (e) Correction factor of the
pressure drops (average
temperature = 47.5 °C)
FcGQF Correction factor of the
flow rates (evap.) (average
temperature = 9.5 °C)
FcGQC Correction factor of the
flow rates (condenser)
(average temperature
=47.5 °C)
NOTE
Even if the graph arrives at
external air temperatures of -40
°C, the machine's operational
limits must be kept as reference.

 Loading...