Contents ▲ 174 ▼ Index
Generating Dot Plots
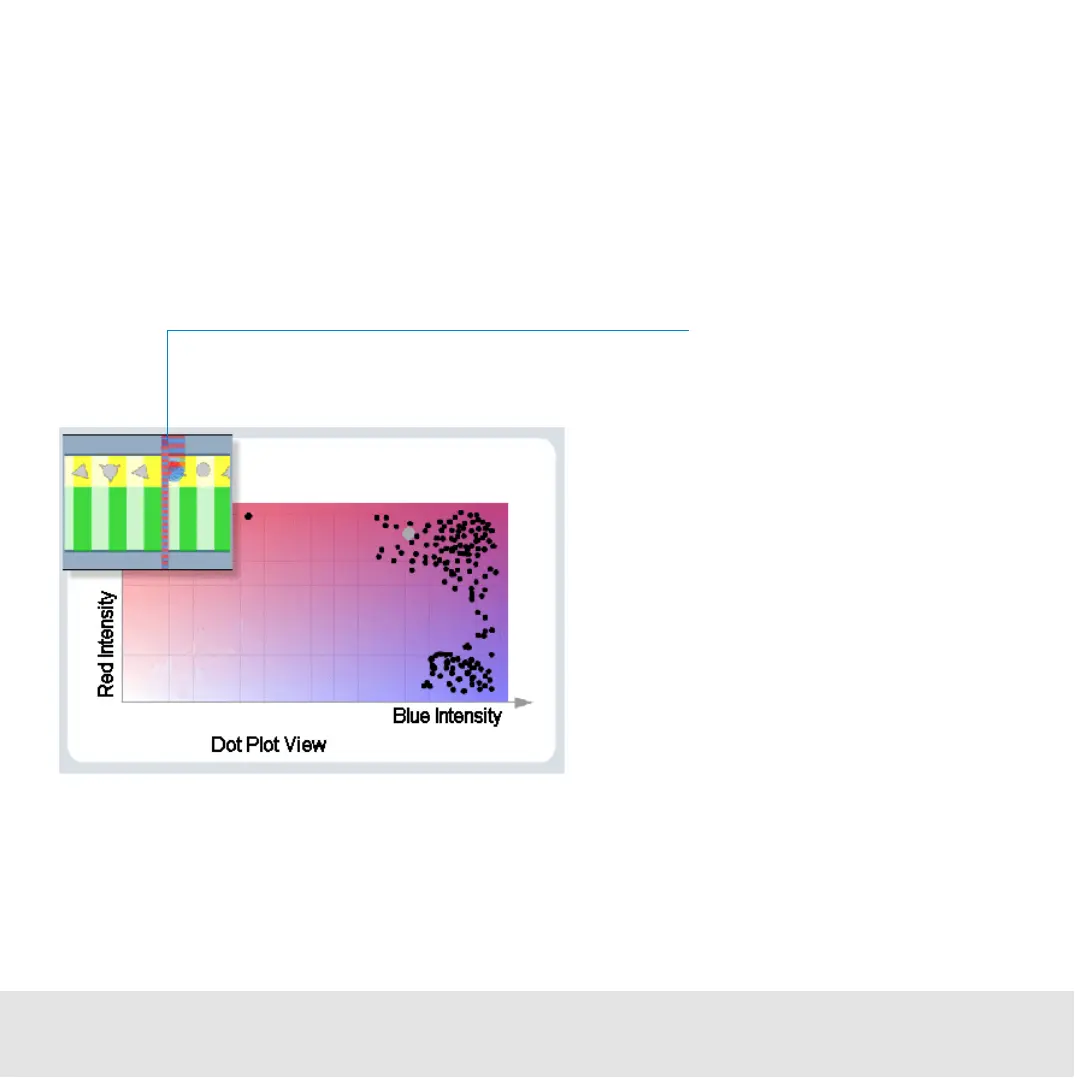
Single events can also be displayed related to both fluorescence values, generating a
map of dot plots. In dot plot view, the events (cells with a minimum fluorescence
intensity) are displayed in a coordinate system (logarithmic axis scaling). Each axis
represents a fluorescence color. A high number of events (cells) with similar
fluorescence values are displayed as a dense cluster of dots, as shown in the following
image.
To determine the number of cells whose blue and red fluorescence lies within a defined
range, you can insert regions. Additionally, a gate can be set for either red or blue
fluorescence to obtain percentual values on a defined population.
As a cell passes through the detector, its blue
and red fluorescence values are measured.