EasyManuals Logo

Agilent Technologies 2100 User Manual

Agilent Technologies 2100
366 pages
To Next Page IconTo Next Page
To Previous Page IconTo Previous Page
Page #175 background imageLoading...
Page #175 background image
Contents 175 Index
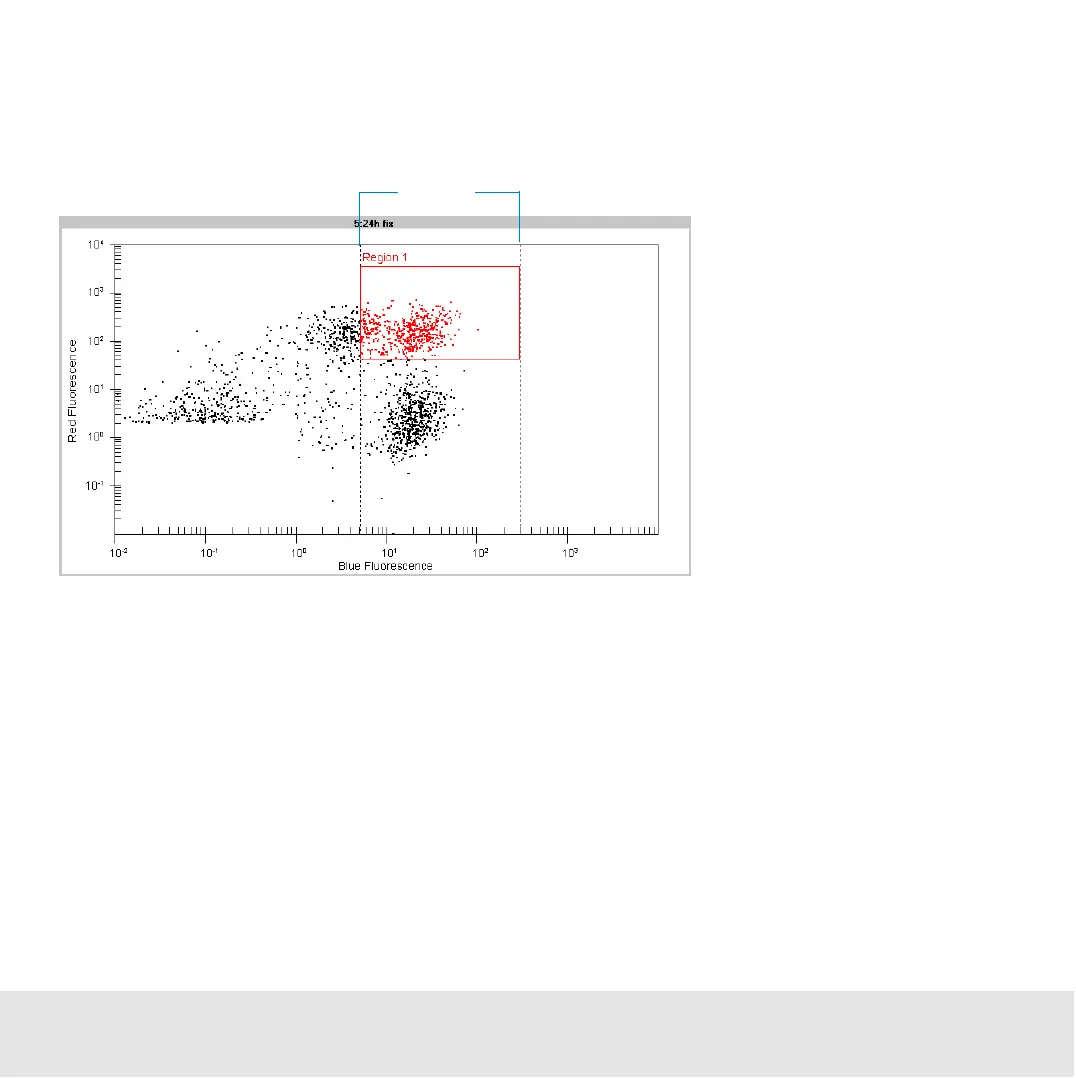
In predefined assays, the borders of the rectangular region represent the markers defined
in the corresponding blue and red histograms.
The lower left region of a dot plot usually shows no events, due to the defined peak
detection threshold that the fluorescence values must exceed.
For detailed information, see “Using Dot Plots for Evaluation” on page 233.
Gate

Other manuals for Agilent Technologies 2100

Questions and Answers:

Question and Answer IconNeed help?

Do you have a question about the Agilent Technologies 2100 and is the answer not in the manual?

Agilent Technologies 2100 Specifications

General IconGeneral
BrandAgilent Technologies
Model2100
CategoryMeasuring Instruments
LanguageEnglish

Related product manuals