Contents ▲ 212 ▼ Index
Using Histograms for Evaluation
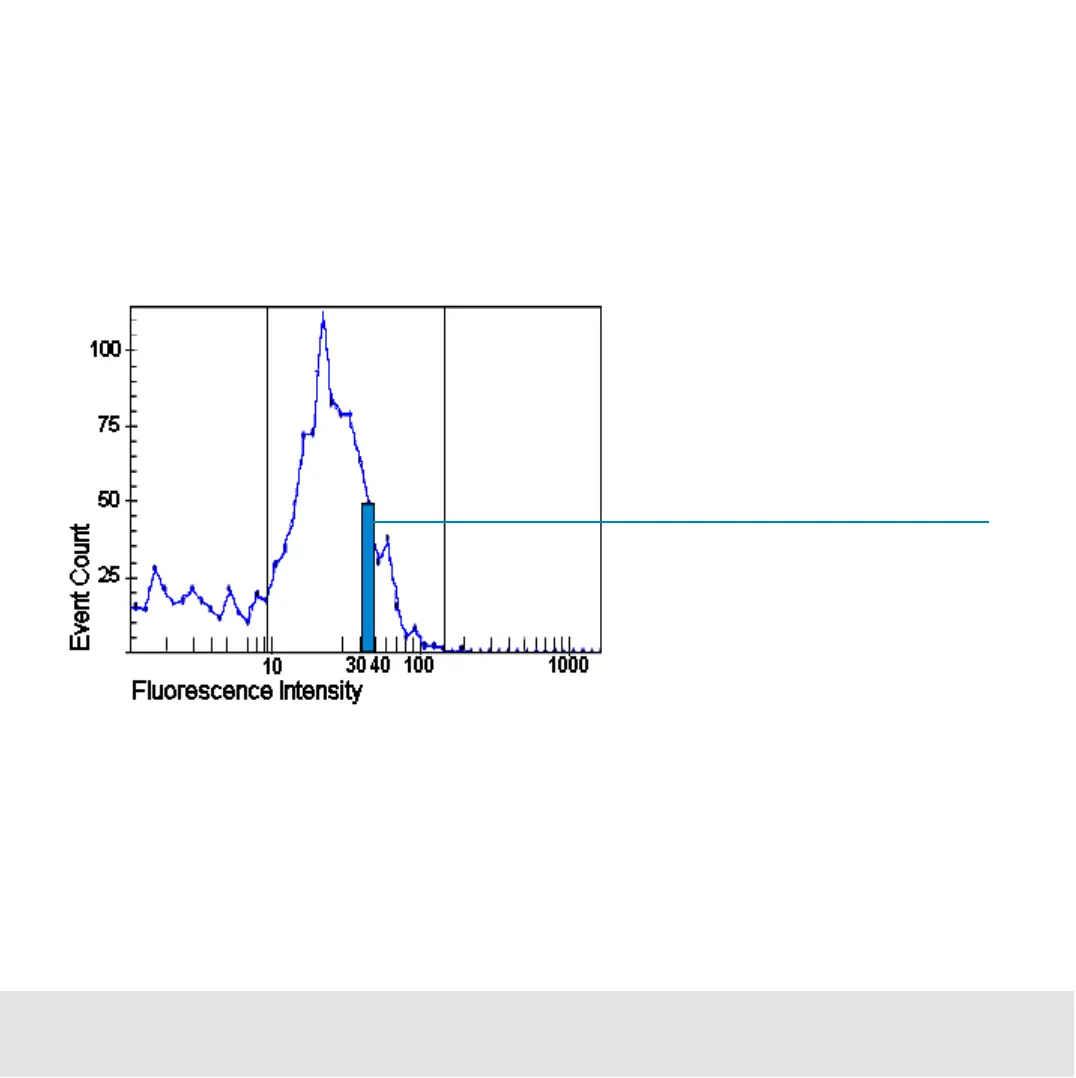
Histograms are graphical representations of the measurement results, where the number
of events (cells) is mapped to the Y axis and their fluorescence values to the X axis. The
resulting curves show the frequency distribution of the events in relation to their
fluorescence intensity values, as shown in the following image. In real histograms, the
bin is reduced to a dot (data point).
The histograms can be evaluated statistically with markers that allow you to define
ranges of fluorescence intensity values. One histogram can be used to represent a range
of fluorescence values to define a subset of events. Only cells with a fluorescence value
within this range are displayed in the second histogram. This method is called gating.
50 cells were detected with a
fluorescence intensity between
30 and 40

 Loading...


