Contents ▲ 213 ▼ Index
Markers
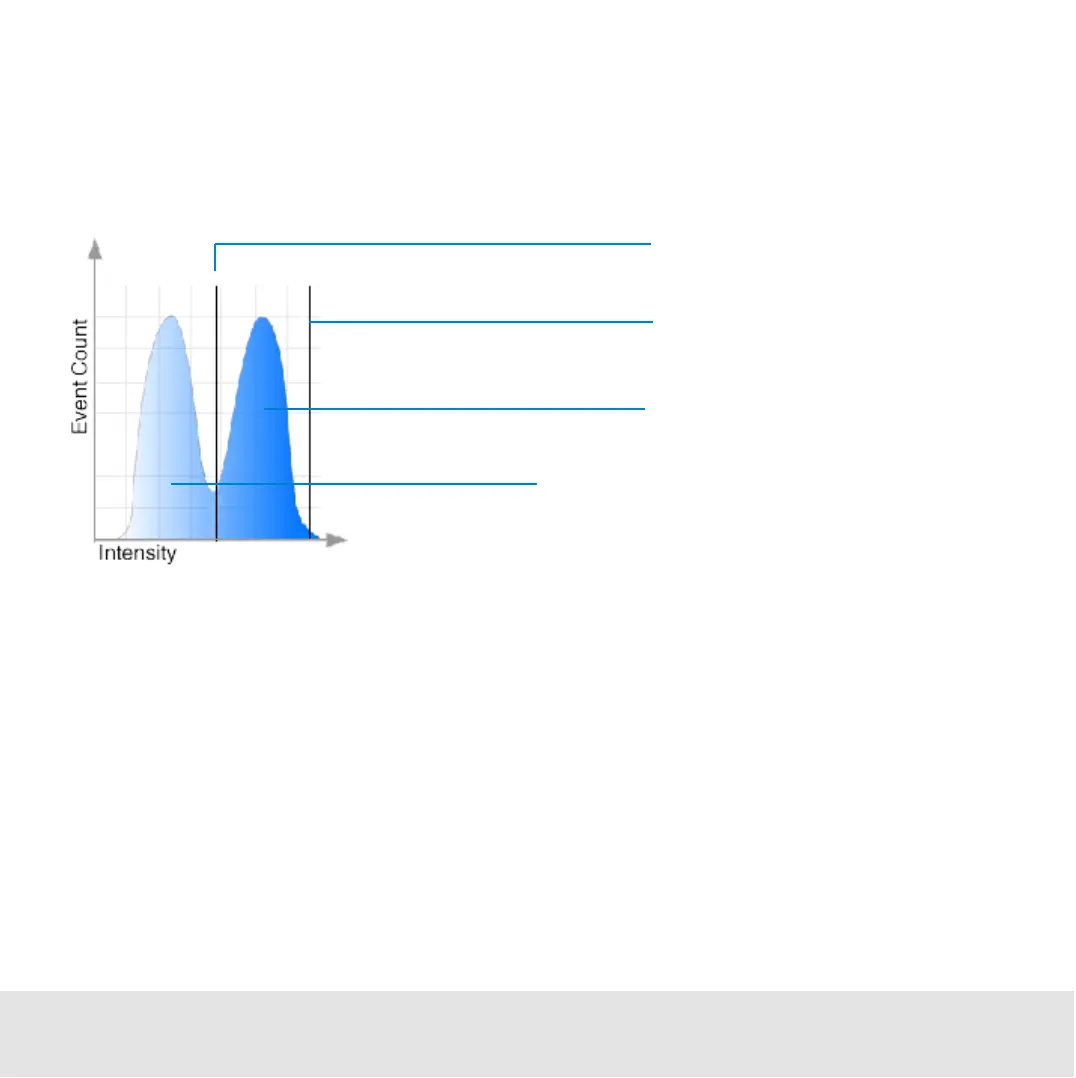
Markers are used to define a range of fluorescence intensity values in a histogram. The
upper and lower limits of the range are displayed as vertical lines, as shown in the
following image.
The numerical values for each defined marker are displayed in a separate row in the
result table. One marker is used as a gate for the second histogram, to define a subset of
events.
In predefined assays, the markers are set by default and you only need to adjust their
position. If you want to define your own assays, select the Generic assay for acquisition,
where you can define your own markers and/or regions together with gates.
If you use several markers within one histogram, only one of them can be used for gating.
The other markers can only be used to evaluate regions in the histogram they cover. The
values belonging to these markers are also displayed in the result table.
Events (cells) of interest
Low intensity
Lower limit of the marker
Upper limit of the marker

 Loading...


