EasyManuals Logo

Agilent Technologies 2100 User Manual

Agilent Technologies 2100
366 pages
To Next Page IconTo Next Page
To Previous Page IconTo Previous Page
Page #219 background imageLoading...
Page #219 background image
Contents 219 Index
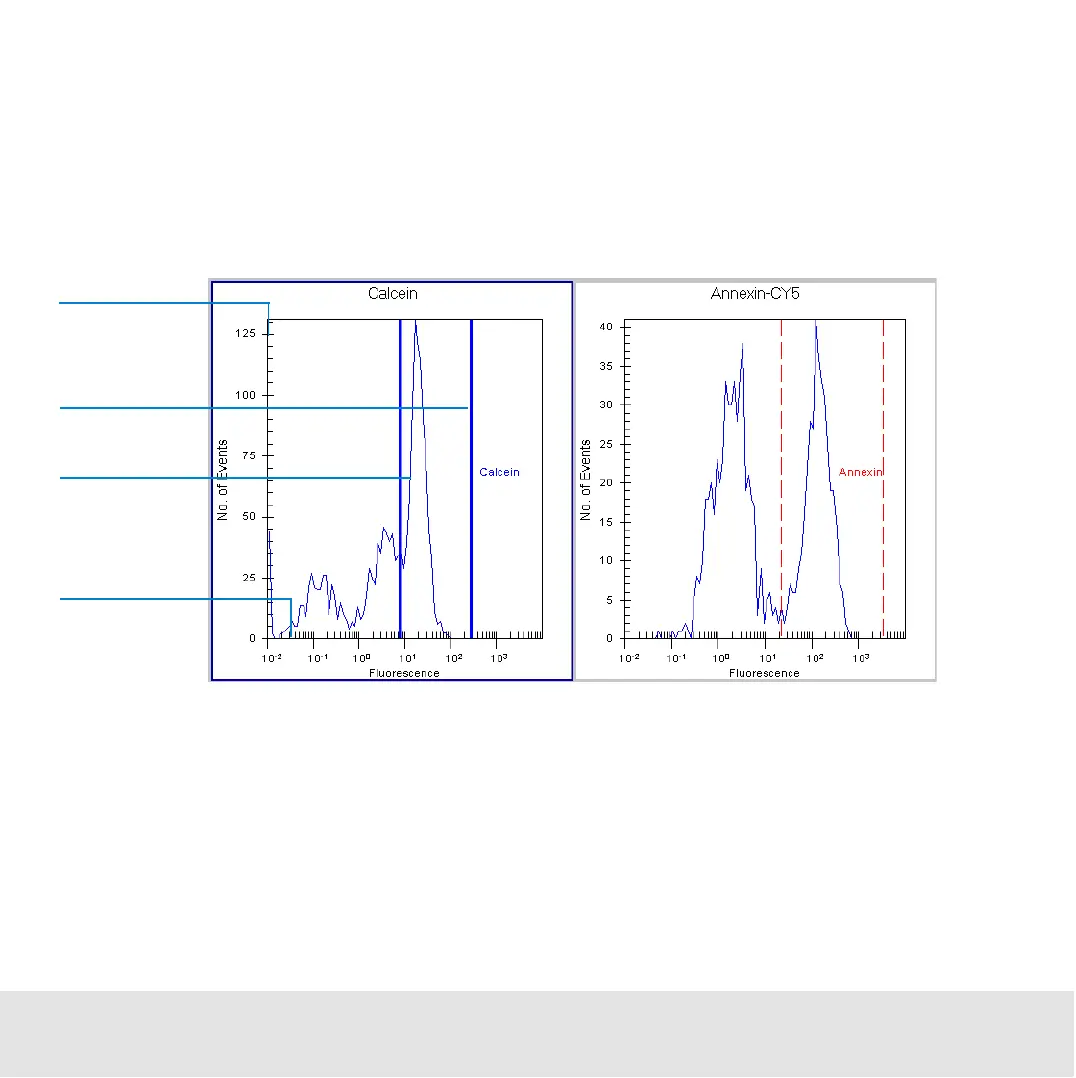
The following image shows two histograms with a gating direction from blue to red (left
to right) of an apoptosis assay. The blue histogram shows calcein fluorescence, which
indicates living or dead cells (high fluorescence value means living cells). The red
histogram shows the subpopulation of living cells with annexin V fluorescence indicating
apoptosis (high fluorescence value means the cell is apoptotic). As a result you can see a
subset of living, apoptotic cells.
Number of
events
Fluorescence
value
Histogram
Marker

Other manuals for Agilent Technologies 2100

Questions and Answers:

Question and Answer IconNeed help?

Do you have a question about the Agilent Technologies 2100 and is the answer not in the manual?

Agilent Technologies 2100 Specifications

General IconGeneral
BrandAgilent Technologies
Model2100
CategoryMeasuring Instruments
LanguageEnglish

Related product manuals