Contents ▲ 218 ▼ Index
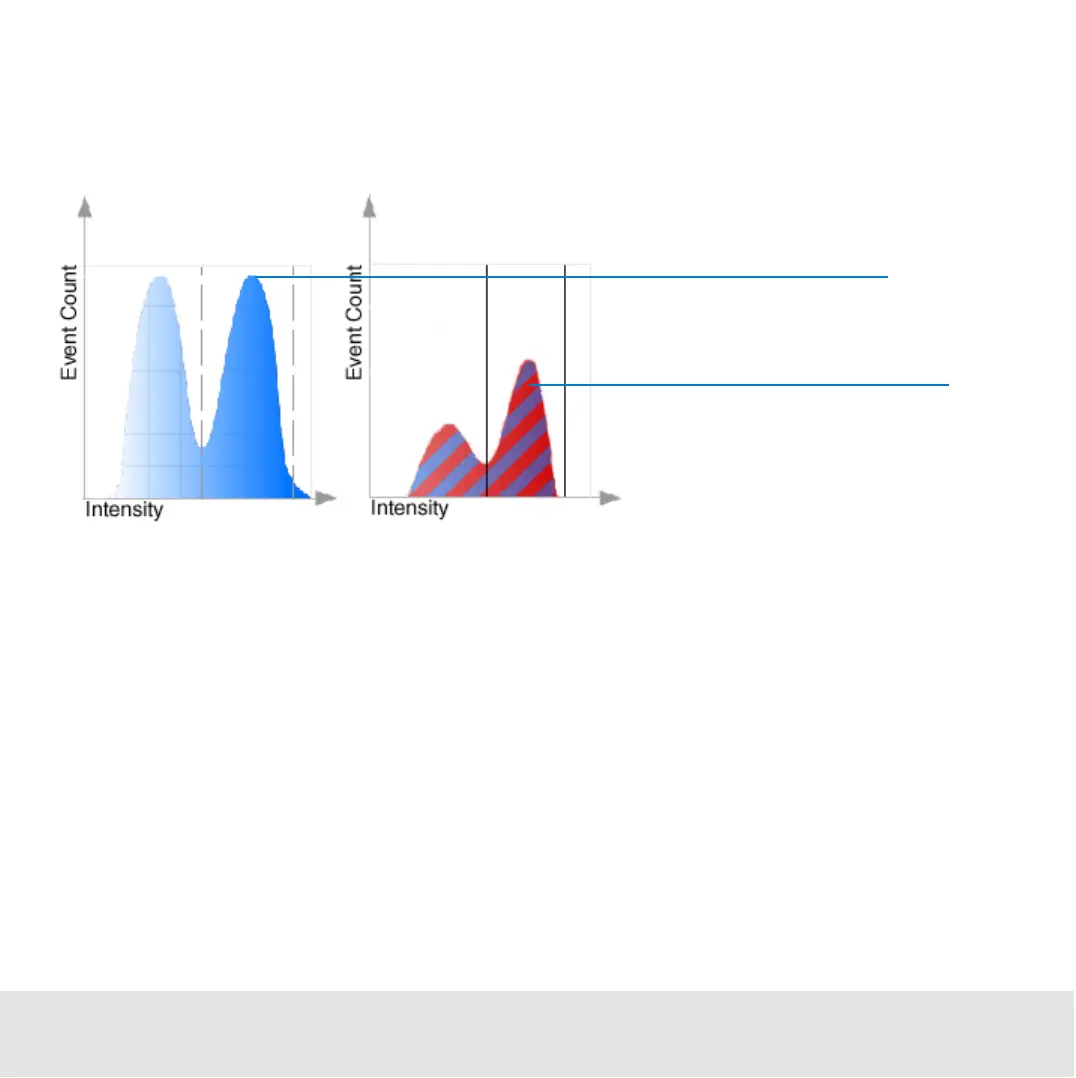
The red histogram displays now only cells with blue and red fluorescence within the
marker. To evaluate this subset, you can set a marker in the red histogram. This second
marker filters out all cells that do not have fluorescence in this range.
The result table (see also “Displaying the Results of Histogram Evaluations” on page 230)
of the gated histogram (here the red one) shows the values numerically:
• The % total value shows the number of events that have both high blue and high red
fluorescence, in relation to all measured events.
• The % of gated value shows the number of events that have high blue and high red
fluorescence in relation to the blue (or red) events.
Events that show both high
blue and high red
fluorescence
Events with high blue
fluorescence

 Loading...


