Contents ▲ 230 ▼ Index
Displaying the Results of Histogram Evaluations
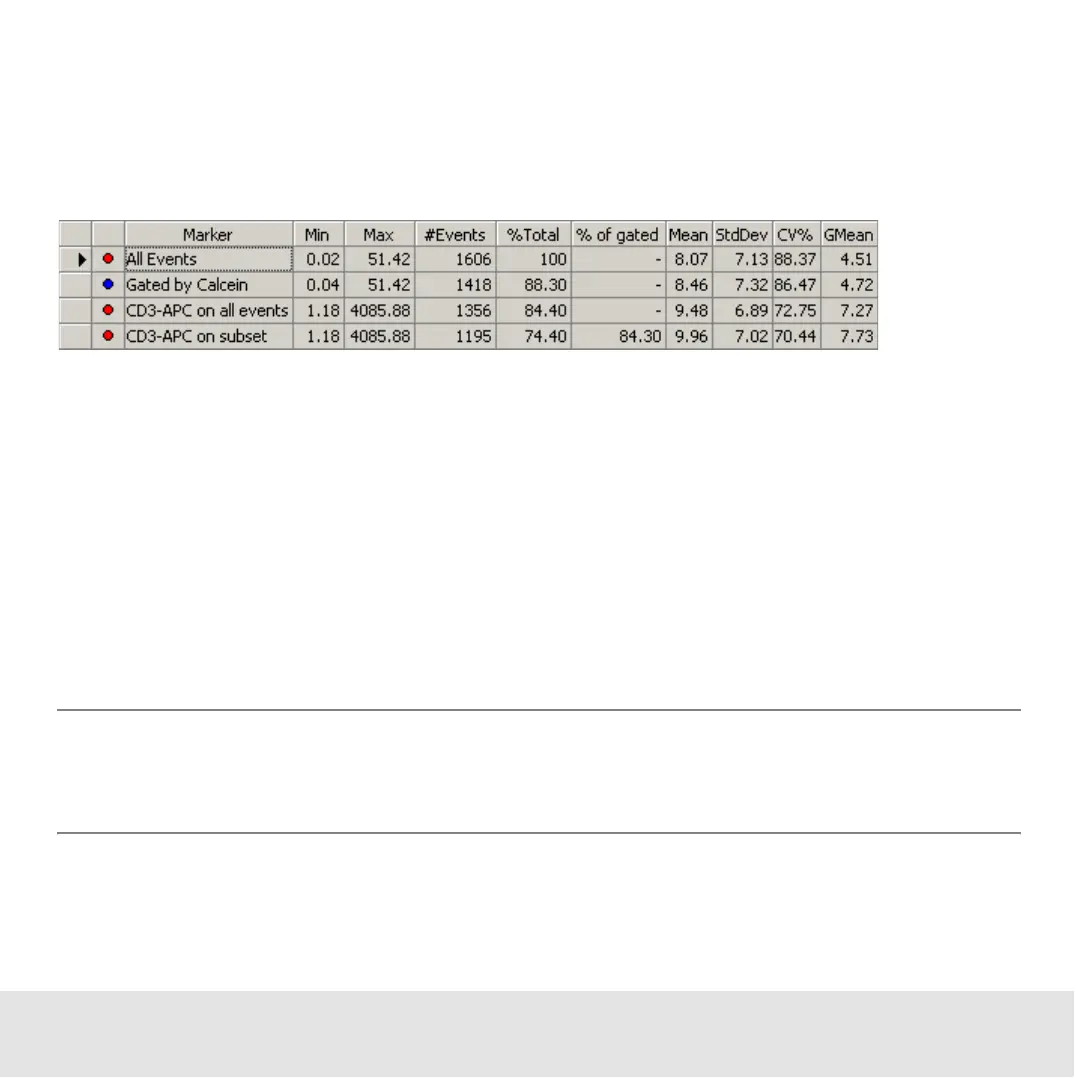
The calculated results are displayed in result tables, one table below each histogram.
Markers, gates, several statistical values, and the %-values of events are shown in the
result tables.
Each marker you insert in the histogram gets its own row. Note that you can only use one
marker for gating. The additional markers can be used to evaluate different parts of the
histogram statistically.
If the option Hide superset curve is disabled in the setpoint explorer, two additional rows
are displayed in the gated histogram’s result table. The superset curve shows a
histogram of all measured events; the gate is not considered.
You can export the table data for further evaluation in other applications. See “Exporting
Data” on page 277.
NOTE
The layout of the result table can be configured (see “Configuring Tables” on
page 293). Not all of the values listed below may therefore be visible.

 Loading...


