EasyManuals Logo

Agilent Technologies 2100 User Manual

Agilent Technologies 2100
366 pages
To Next Page IconTo Next Page
To Previous Page IconTo Previous Page
Page #229 background imageLoading...
Page #229 background image
Contents 229 Index
How to Set Signal Colors for Overlaid Histograms
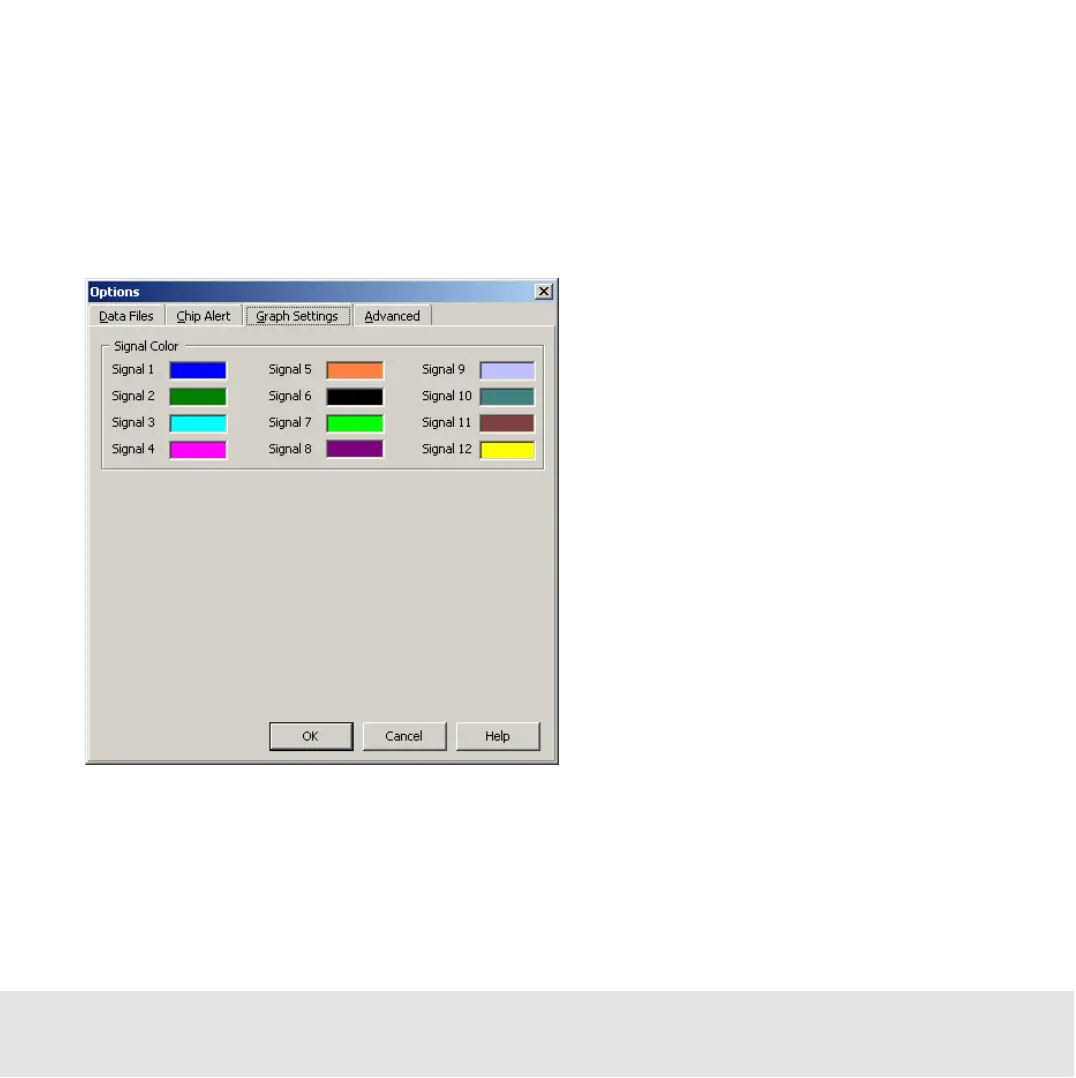
You can use the Graph Settings tab in the Options dialog box to configure the signal
colors (colors of curves in histograms):
1 Select Tools > Options.
2 Click the Graph Settings tab to bring it to the front.
To configure the signal color:
1 Click the colored square corresponding to the signal.
The Color dialog box appears.
2 Select a color for the signal and assign it by clicking OK.

Other manuals for Agilent Technologies 2100

Questions and Answers:

Question and Answer IconNeed help?

Do you have a question about the Agilent Technologies 2100 and is the answer not in the manual?

Agilent Technologies 2100 Specifications

General IconGeneral
BrandAgilent Technologies
Model2100
CategoryMeasuring Instruments
LanguageEnglish

Related product manuals