Contents ▲ 234 ▼ Index
How to Add Regions to Dot Plots (Generic Assay only)
You can draw regions in dot plots of generic assays. If there are regions already defined in
other samples, you can copy these regions in the dot plot of the current sample.
To draw a new region:
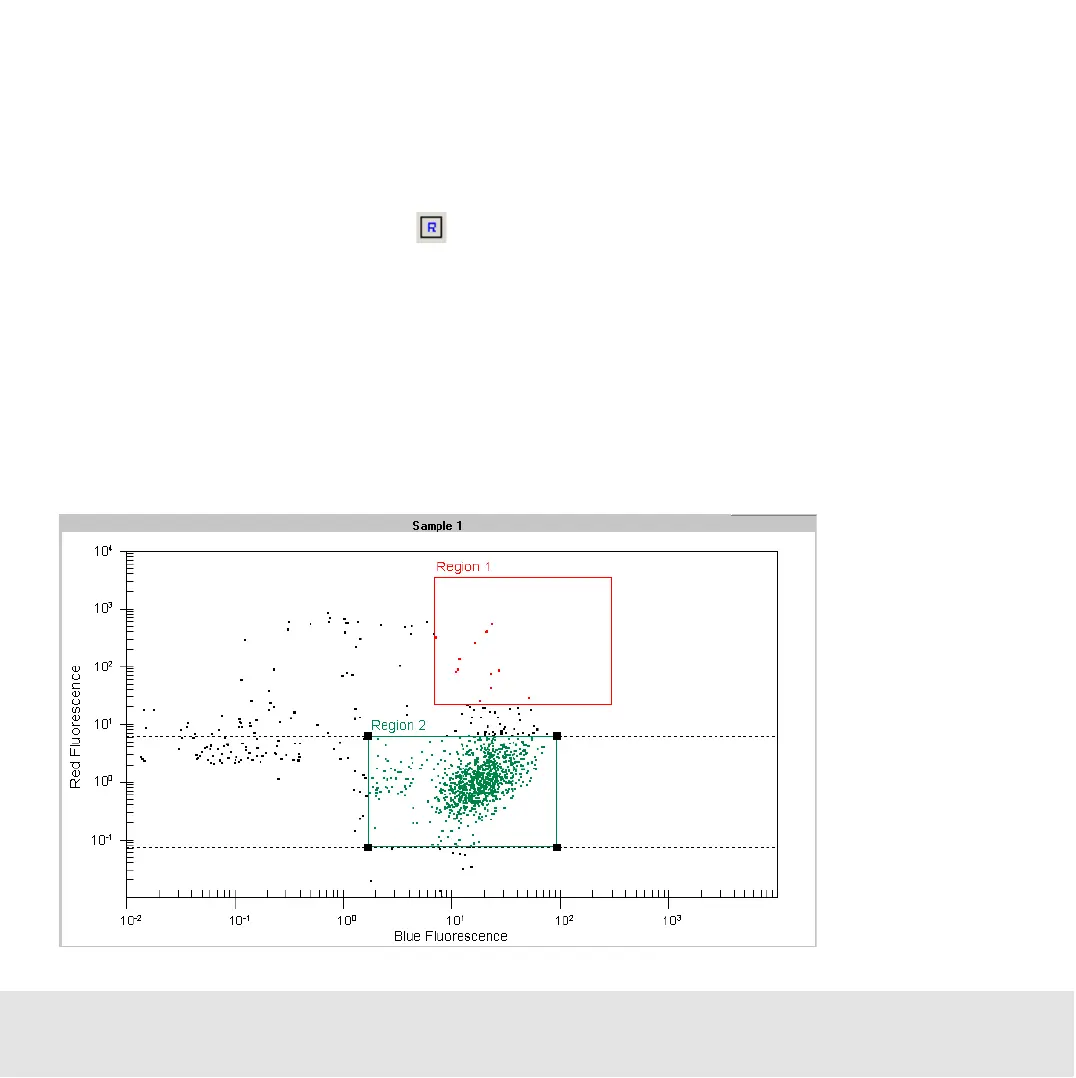
1 Click the Insert Region button in the toolbar.
The mouse pointer changes its shape to a crosshair.
2 Draw a rectangle into the dot plot.
New regions are automatically named “Region x”, where x is an auto-incremented
number. By default, the border color of new regions is black. To make it easier to
differentiate between regions, you can change their border color (see “How to Configure
Regions” on page 236).

 Loading...


