Contents ▲ 249 ▼ Index
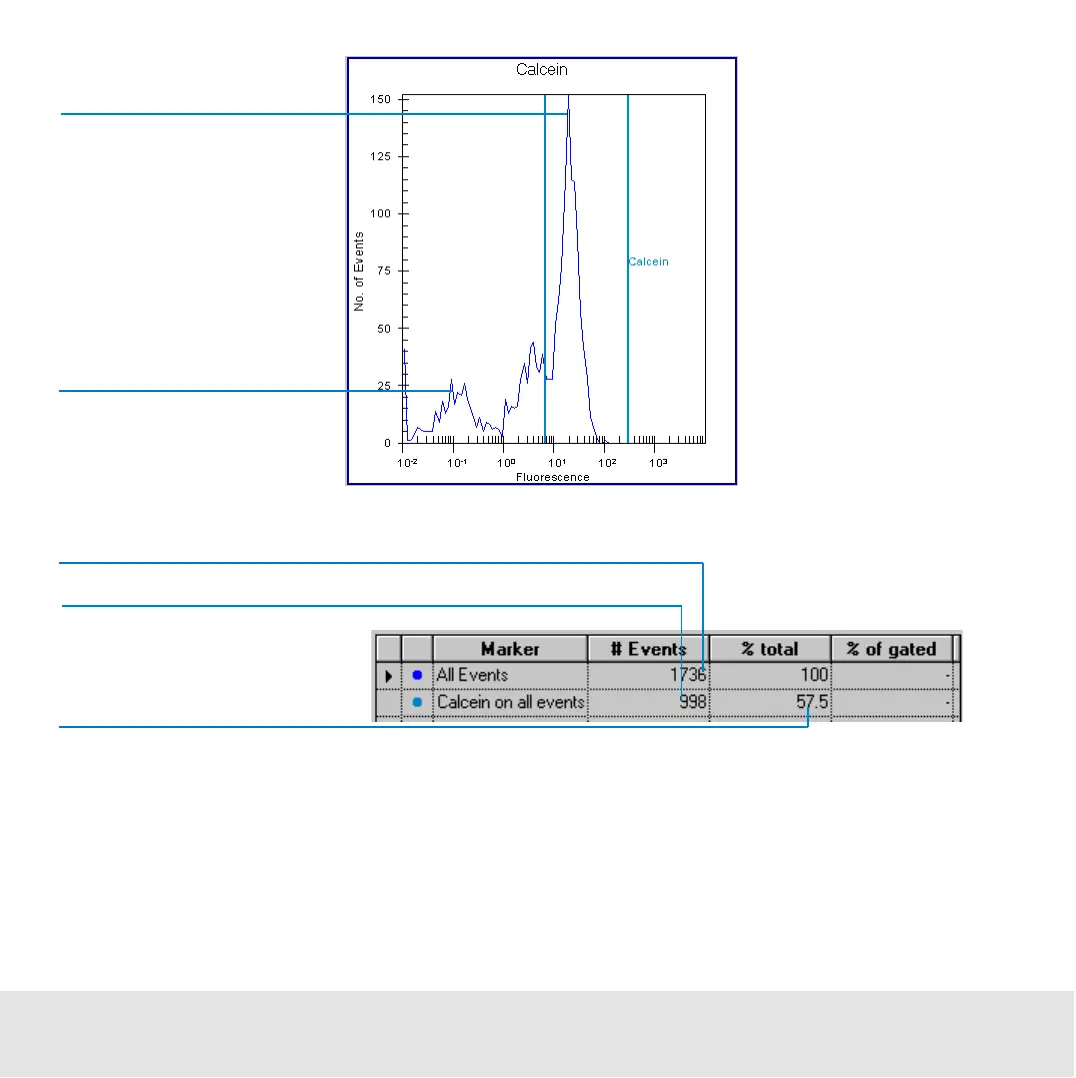
The values are displayed in the result table, each histogram has its own table:
When using the calcein marker in the blue histogram for gating, only the living cells are
considered for building the red histogram. High red fluorescence values indicate living,
apoptotic cells, low red fluorescence values indicate living, non-apoptotic cells. See the
following example.
Low fluorescence value
indicates dead cells
High fluorescence value
indicates living cells
All measured events
All events in relation to the
blue marker (here calcein)
Living cells in relation to all measured cells (high calcein fluorescence)

 Loading...


