Contents ▲ 26 ▼ Index
7 In the tree view panel, click any sample name or the ladder.
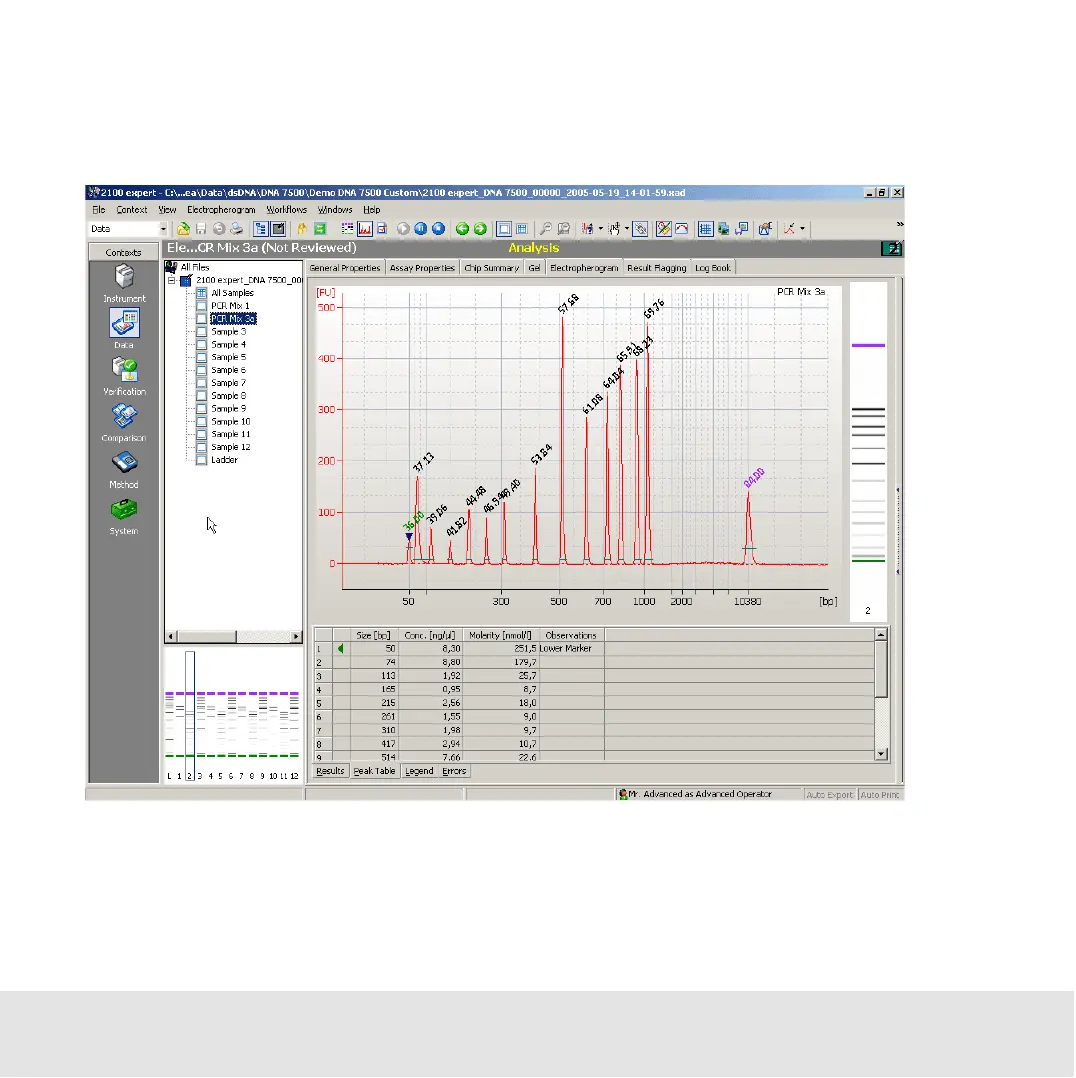
This selects the Electropherogram tab, which displays a data plot of size/migration
time versus fluorescence intensity.
Peaks have automatically been detected, and their characteristics such as size,
concentration, purity, or molarity have been calculated and are shown in the Peak Table
at the bottom of the window.