Contents ▲ 96 ▼ Index
Computation of the RNA Integrity Number and Signal Anomalies
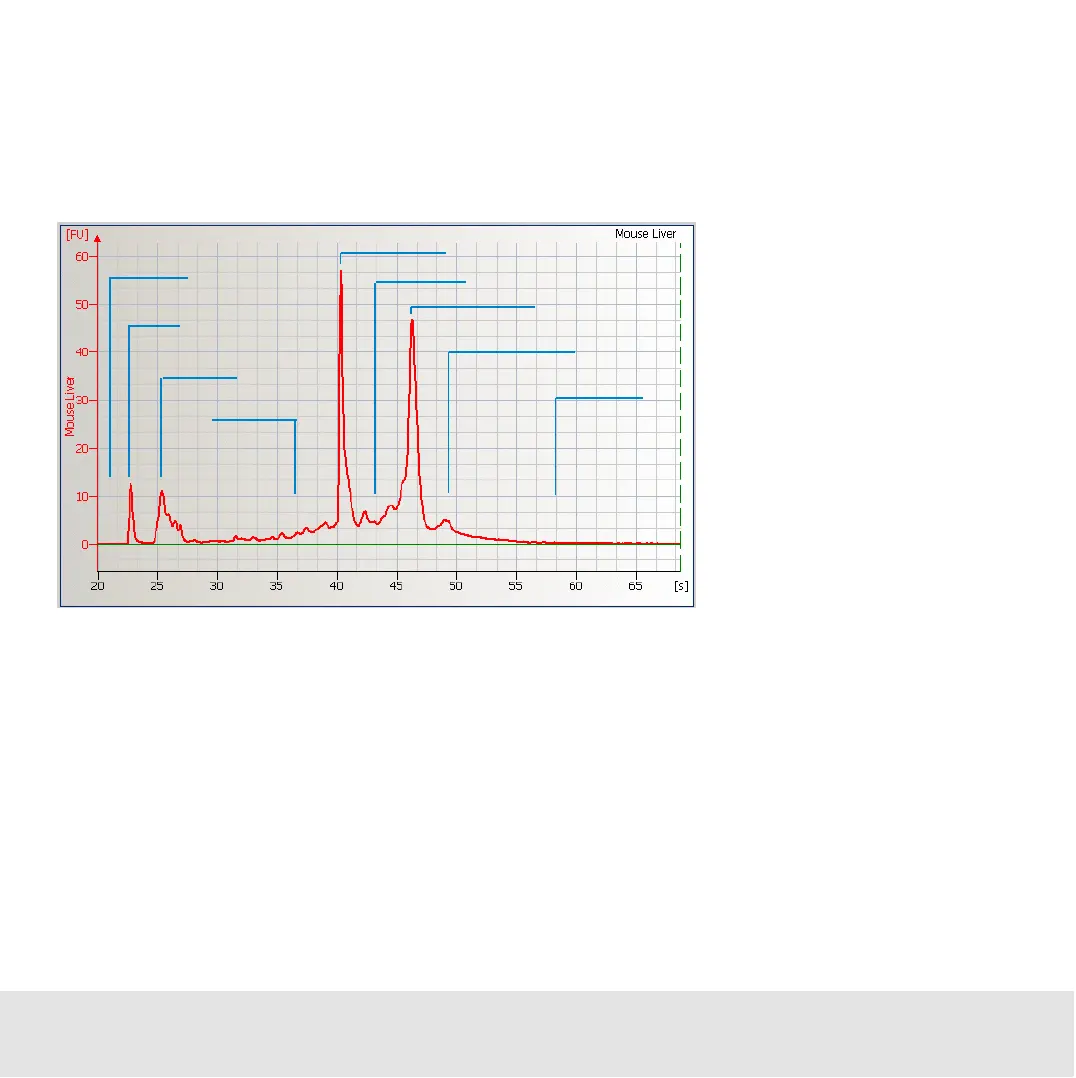
For the computation or the RNA integrity number, the electropherogram is partitioned
into regions as shown in the figure below. The lower marker and the 18S and 28S
fragments divide the electropherogram into nine regions:
Signal Anomalies
In addition to the computation of the RIN, the data analysis detects various unexpected
signals, disturbing the computation of the RIN. Such disturbances are called anomalies.
Region anomaly detectors recognize unexpected signals in each region. If detected, the
anomaly is displayed in the Error sub-tab of the Electropherogram and Gel tab.
pre-region
marker
5S-region
fast-region
18S-fragment
inter-region
28S-fragment
precursor-region
post-region