APPENDIX - Examples
Agilent 7100 CE in Empower Environment 39
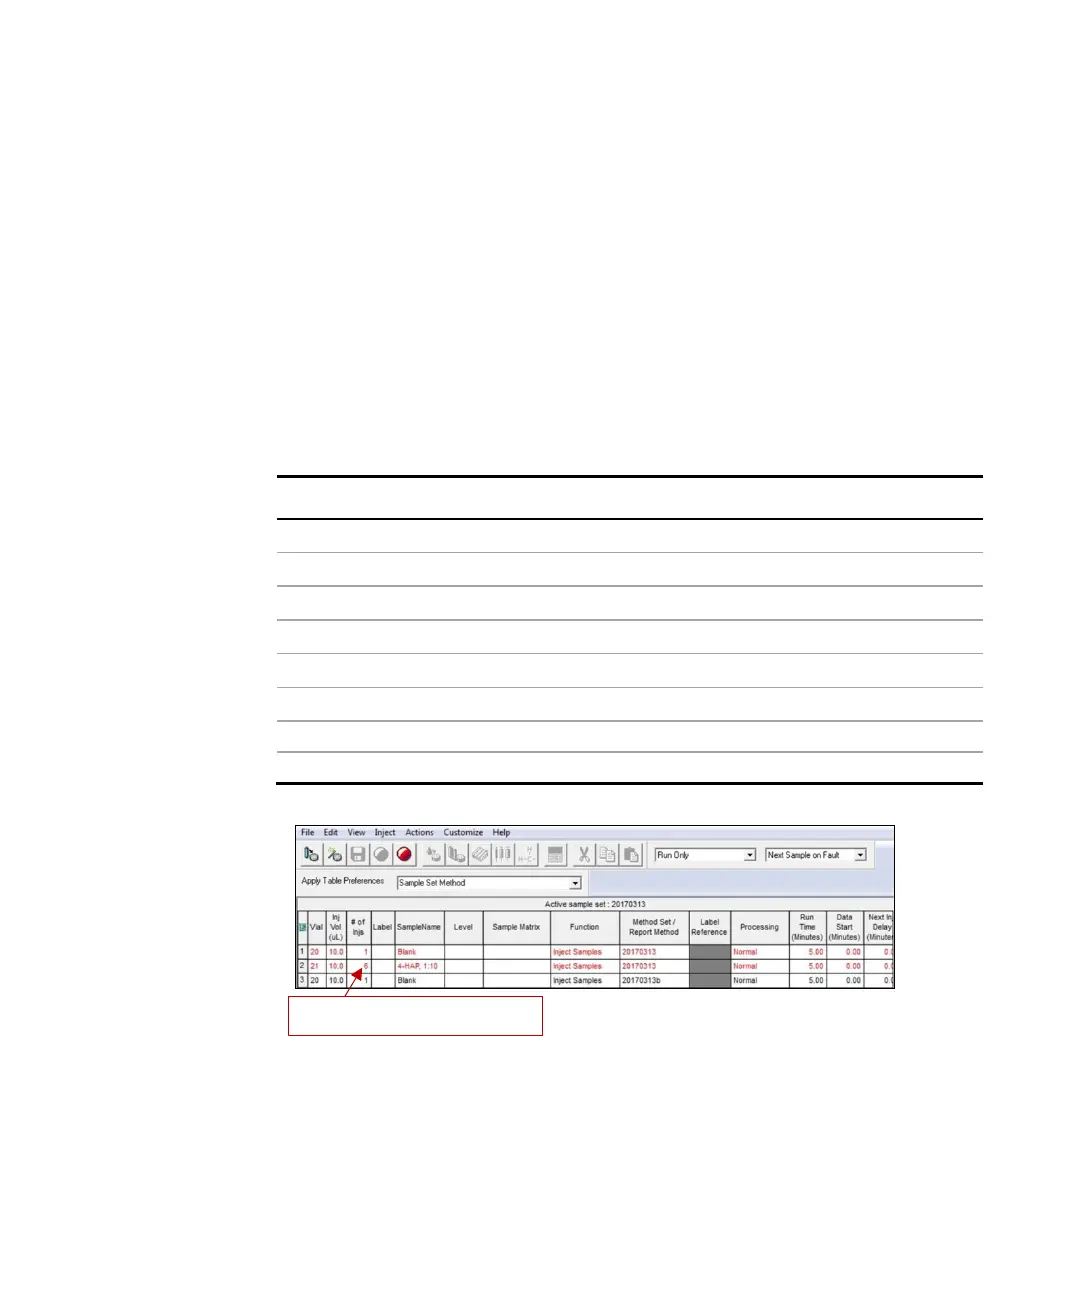
Example: Multiple injections using the IQ Kit for CE
For testing multiple injections in one sequence, the instrument method and
the experimental setup described in section Example: Single test run can be
used. See the sequence table (Figure 27) and the overlay of the resulting
electropherograms (Figure 28).
A set of six injections was used to calculate system precision. The peak
areas and relative standard deviations (Excel: STDEV) for the areas,
migration times and the corrected areas are summarized in the following
table.
Table 2 Peak areas and relative standard deviations
Area t
m
[min] t
m
[s] corr. Area (area/t
m
[s])
Injection 1
50049
Injection 2
50547
2.723 163.38 3.09383E+02
Injection 3
50189
2.717 163.02 3.07870E+02
Injection 4
49767
2.711 162.66 3.05957E+02
Injection 5
49187
2.706 162.36 3.02950E+02
Injection 6
49579
2.702 162.12 3.05817E+02
Average 49886 2.715 162.89 3.06254E+02
Deviation STDEV: 0.96 % 0.39 % 0.39 % 0.72 %
Figure 27 Sequence table for multiple injections
Sixfold sample injection

 Loading...