30
Appendix
Performance data
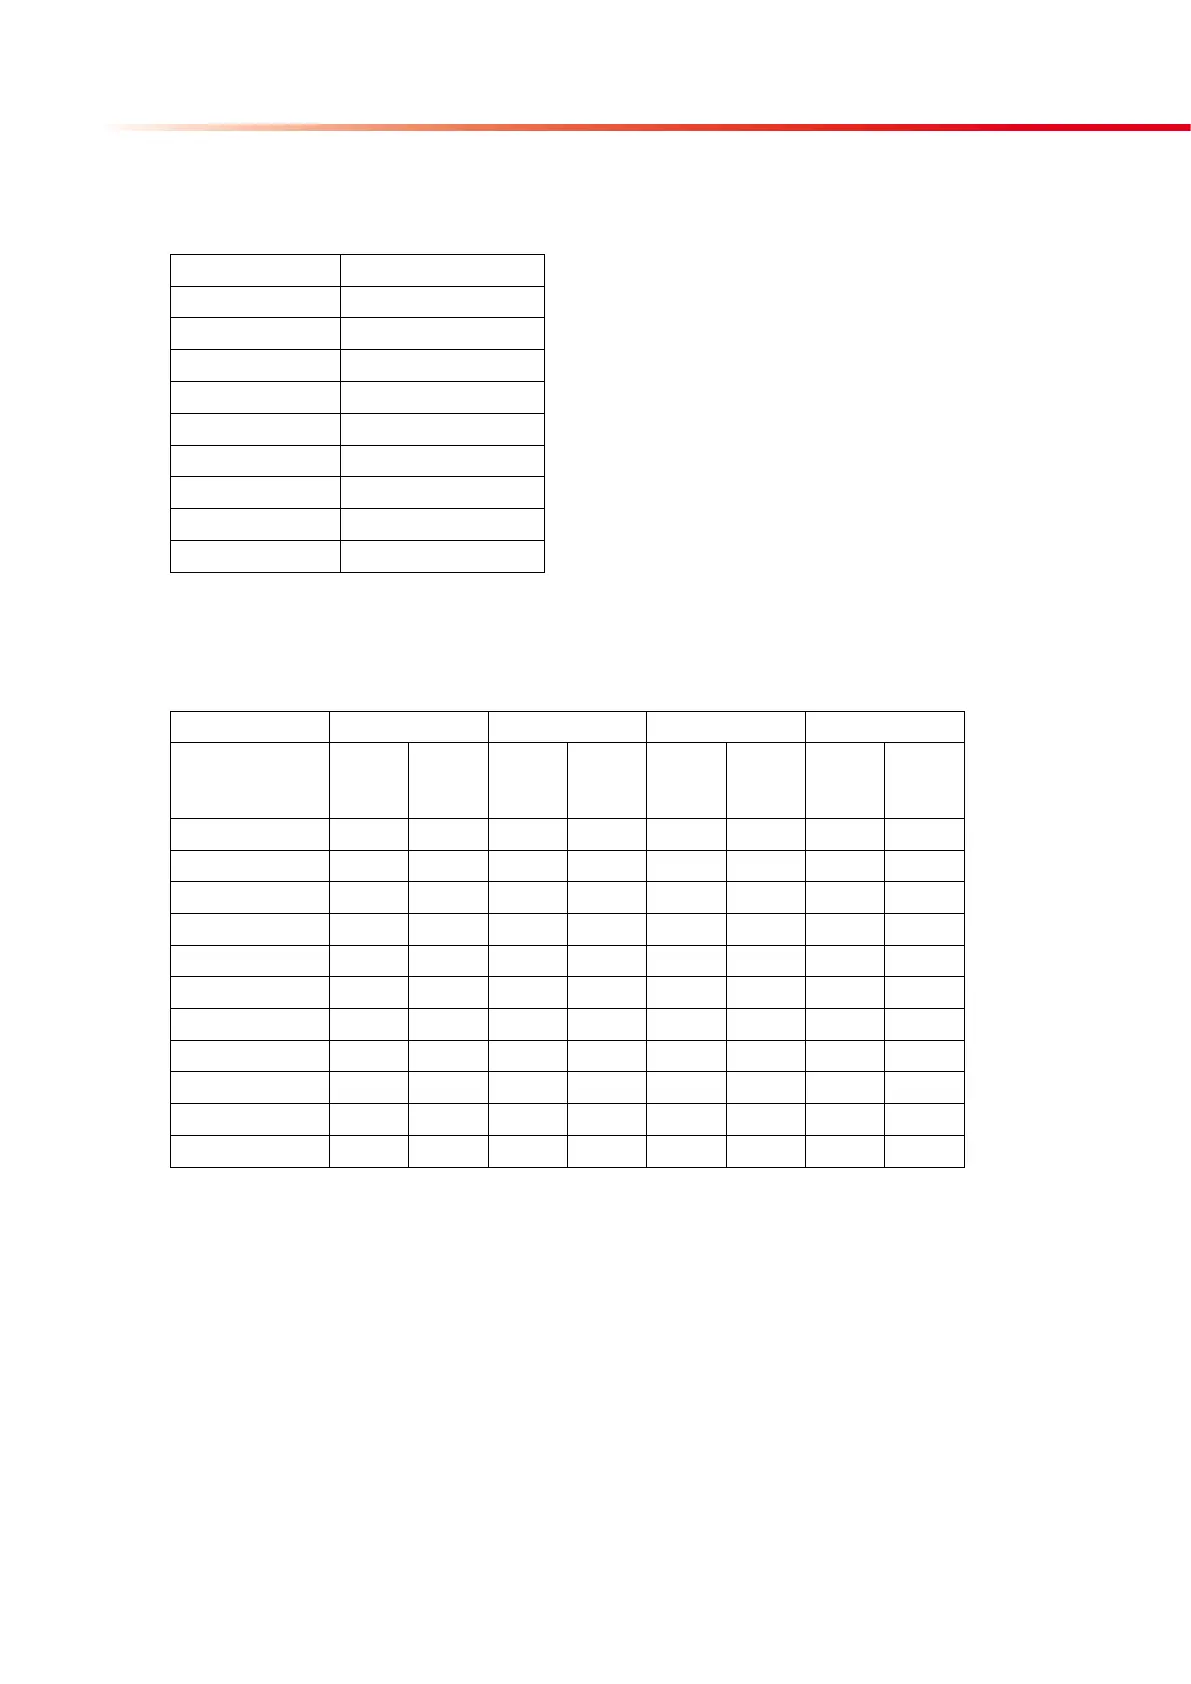
Detection Limit
Parameter Detection Limit *
Ascorbic acid 15 mg/dl
Bilirubin 0,6 mg/dl
Blood 6-8 Ery/µL (as Hb)
Glucose 40-50 mg/dl
Ketones 4-6 mg/dl
Leucocytes 10-15 Leu/ul
Nitrite 0,1 mg/dl
Protein 20 mg/dl
Urobilinogen 1,5 mg/dl
* Since the concentration of normal urine constituents may vary between different sam-
ples, the detection limit also may show variations.
Agreement to Reference
Comparison 1 Comparison 2 Comparison 3 Comparison 4
Parameter same
colour
block
+/–1
colour
block
same
colour
block
+/–1
colour
block
same
colour
block
+/–1
colour
block
same
colour
block
+/–1
colour
block
Ascorbic acid 84,8% 100% 84,8% 100% – – 100% 100%
Bilirubin 68,8% 100% 93,8% 100% 86,7% 99,6% 100% 100%
Blood 92,0% 100% 98,2% 100% 90,7% 100% 100% 100%
Glucose 86,6% 100% 89,3% 100% 90,7% 97,8% 93,6% 100%
Ketones 83,0% 100% 93,8% 99,1% 92,9% 99,1% 100% 100%
Leucocytes 83,0% 98,2% 91,1% 100% 84,1% 99,1% 98,4% 100%
Nitrite 99,1% 100% 96,4% 100% 94,7% 100% 100% 100%
pH 90,2% 100% 60,7% 99,1% 64,2% 100% 100% 100%
Protein 86,6% 100% 94,6% 100% 82,3% 97,8% 100% 100%
Spec. gravity 60,7% 96,4% 30,4% 82,1% 33,6% 81,4% 94,7% 100%
Urobilinogen 90,4% 97,6% 83,0% 100% 89,8% 99,1% 100% 100%
For clinical utility, test principles, expected values, limitations, reagent compositions of
he test pads, storage of test strips and special notes / instructions concerning test strips
pleaser refer to the package insert of the CombiScreen test strips.