Chapter 6 Performing the Pure Dye Calibration
Analyzing the Pure Dye Calibration Data
Applied Biosystems 7300/7500/7500 Fast Real-Time PCR System Installation and Maintenance Guide 79
Notes
6
7. Using the tables in “Evaluating Pure Dye
Calibration Spectra” on page 80 as a reference,
verify that the peak for the spectrum of the pure
dye occurs at the correct filter:
• 7300 system – see page 80
• 7500 system – see page 82
• 7500 Fast system – see page 84
If the peak for the spectra of a dye occurs in the
wrong filter, you may have run the wrong dye
plate during the calibration. Repeat the procedure
using the correct dye.
8.
Select
File
Close
.
The SDS Software displays the plate document
for the next pure dye plate.
IMPORTANT! Do not close a plate document
until you have extracted it. During the
calibration, the software creates plate documents
for each pure dye plate as it was run. You must
extract each one individually before closing it.
9. Repeat steps 1 through 8 to extract the
calibration data for the remaining pure dyes.
When you complete the pure dye spectra calibrations for the remaining dyes, close the remaining plate document,
then continue with “Verifying the Instrument Performance” on page 87.
Select
About Pure Dye Spectra
The product of a pure dye calibration is a collection of spectral profiles that
represent the fluorescence signature of each pure dye standard. Each
profile consists of a set of 96 lines that correspond to the fluorescence
gathered from the 96 wells of the pure dye plate. The SDS software plots
the resulting data for each spectral profile in a graph of fluorescence versus
filter.
When the software extracts the calibration data from a pure dye run, it
evaluates the fluorescence signal generated by each well in terms of the
collective spectra for the entire plate. Dye spectra are generally acceptable
if they peak within the same filter as their group but diverge slightly at other
wavelengths (divergence is not shown in the figure at the right).
The SDS software can compensate for some differences in a spectral profile
by replacing (auto-repairing) the spectra of unacceptable wells with the
spectra of neighboring wells. However, the software allows only a few
replacements and may reject the calibration if the spectra between
neighboring wells vary significantly.
Note: Because the wells in a pure dye plate contain the pure dye at the
identical concentration, the resulting signals for all wells should be similar.
The variations in spectral position and peak position are caused by minor
differences in the optical and excitation energy between individual wells.
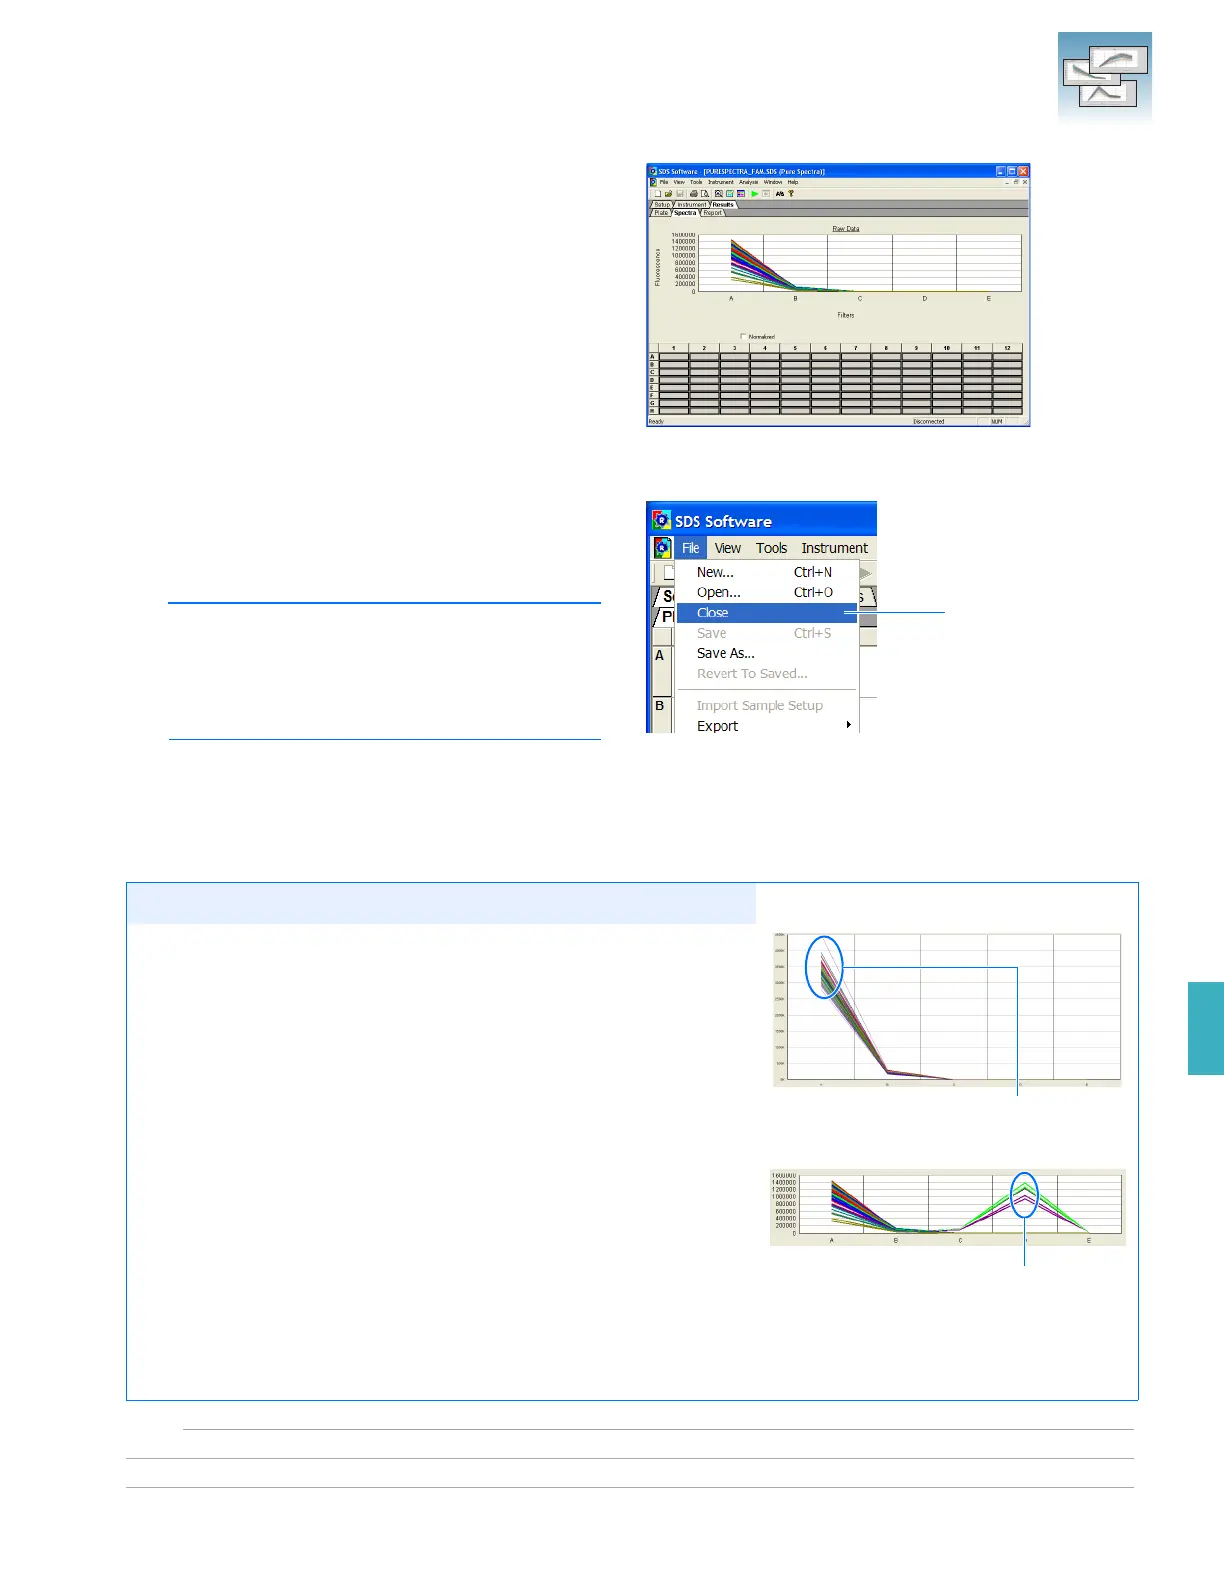
Acceptable Spectra
Unacceptable Spectra
Spectra peak at the same
wavelength and do not
diverge significantly
Several spectra peak at the
different wavelengths