32
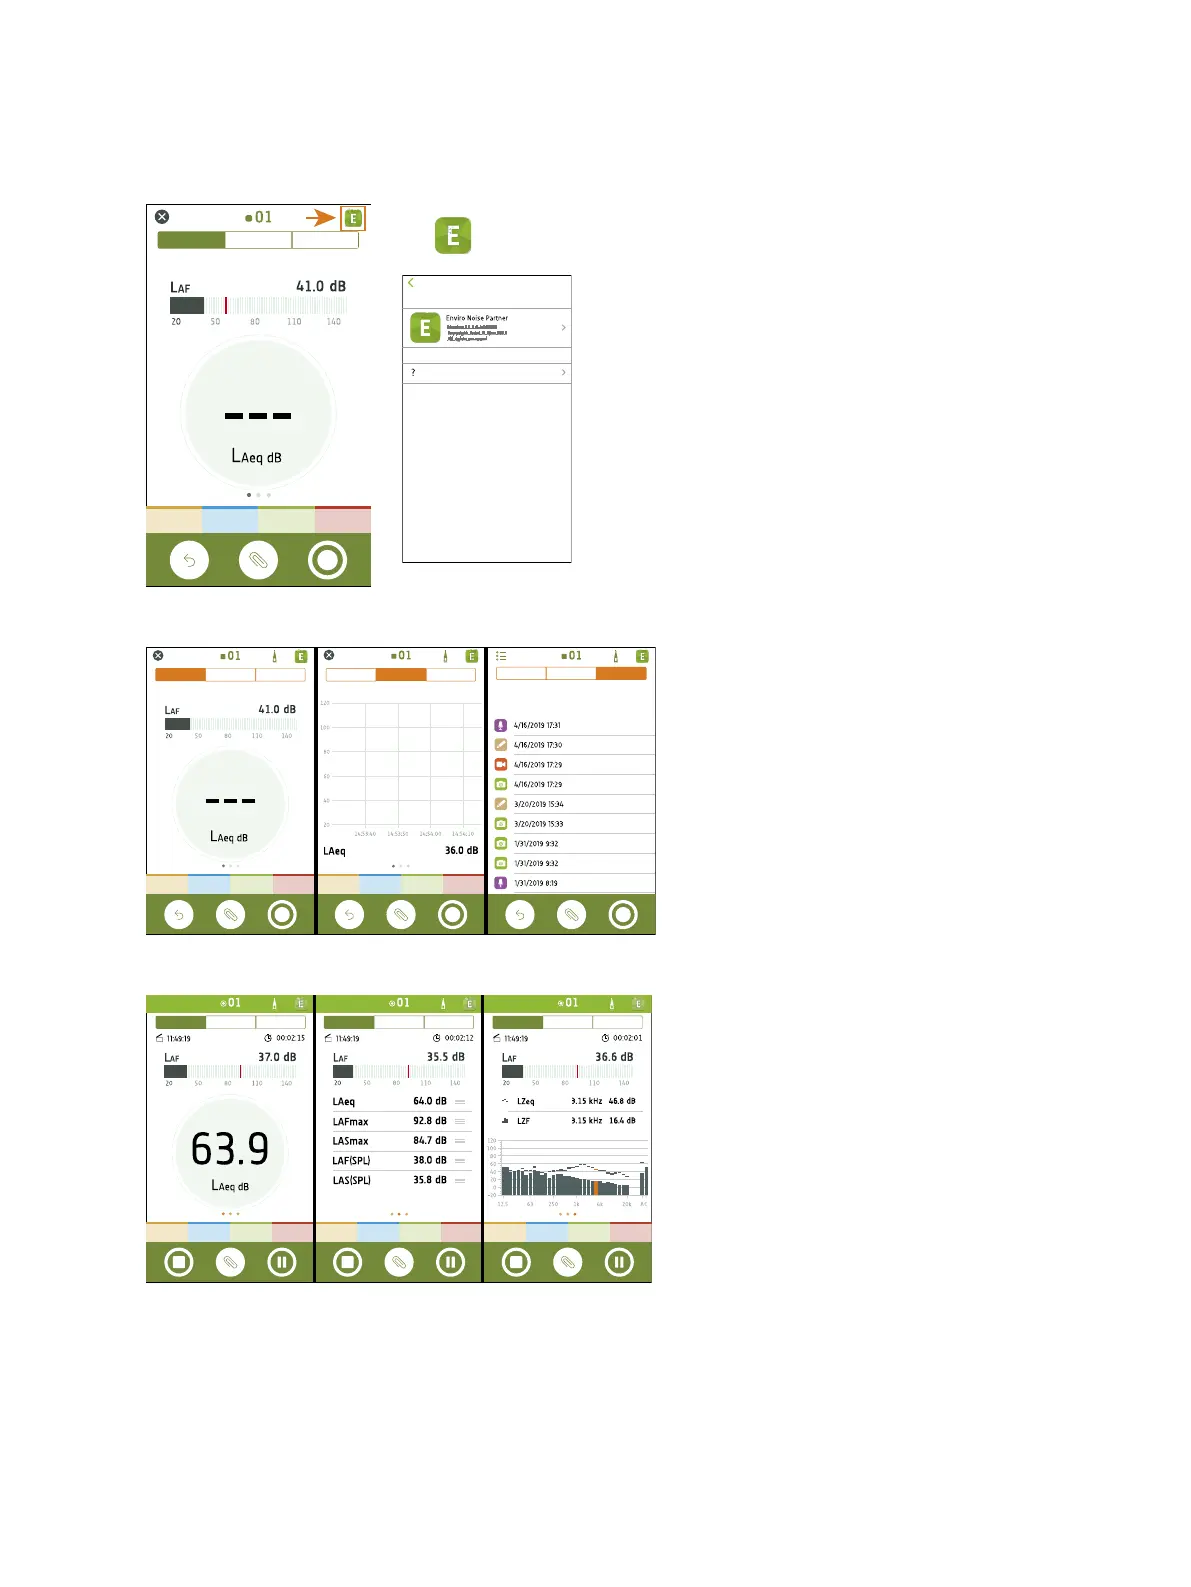
Tap to access information about the mobile app and help.
Use the navigation bar to change between Total
(left), Profile (centre) and Annotations (right).
Total displays instantaneous parameters, para-
meters that are calculated for the total meas-
urement time, and frequency analysis
parameters. It is the main display for single meas-
urements. SLM view (left) shows an instant-
aneous broadband parameter (bar graph) and
one calculated broadband parameter. List view
(centre) shows an instantaneous broadband para-
meter (bar graph) and a list of calculated broad-
band parameters. Spectrum view (right) shows an
instantaneous broadband parameter (bar graph),
and the frequency analysis of two spectrum para-
meters. Each view contains a unique bar graph.
Get Started: Mobile App GUI
 Loading...