33
Swipe left or right to switch between views. Tap on a parameter to change the parameter being displayed. Tap and drag
to move items in the list.
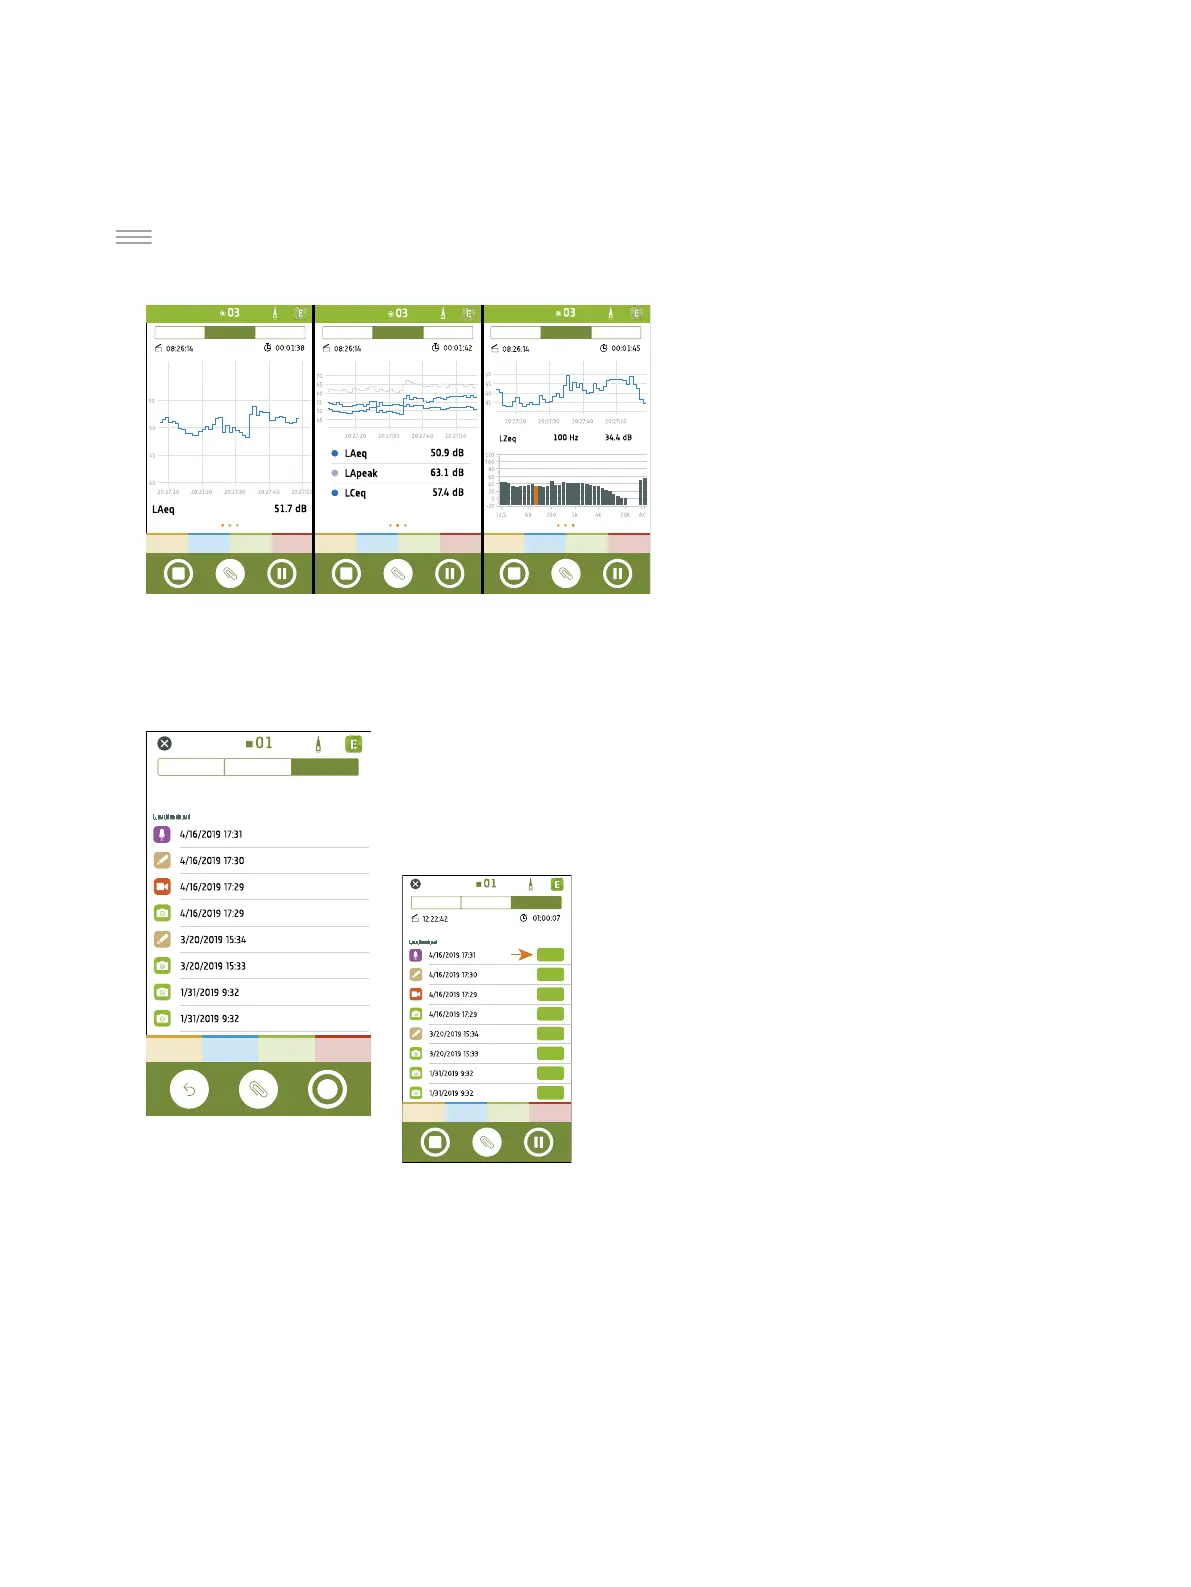
Profile displays the logged broadband and/or spec-
trum parameters (Profile view). It is the main dis-
play for logged measurements.
Swipe left or right to switch between views of a
single logged broadband parameter, multiple
logged broadband parameters or a single logged
spectrum parameter. Tap on a parameter to
change the displayed parameter.
You can interact with the profile graphs: scroll for-
wards and backwards through time, double tap on
the Y-axis to scale the graph to the data, and tap
on unwanted markers to remove them. For the spectrum parameter, highlight different frequencies in the spectrum
graph to view the logging profile graph at each frequency.
Annotations is the list of annotations.
Tap an annotation to review it. Swipe left on an annotation to delete it. While meas-
uring or reviewing a measurement, tap Attach to add an unattached annotation to
the measurement.
Get Started: Mobile App GUI
 Loading...