22
4. Acquire a small amount of the sample to be sorted
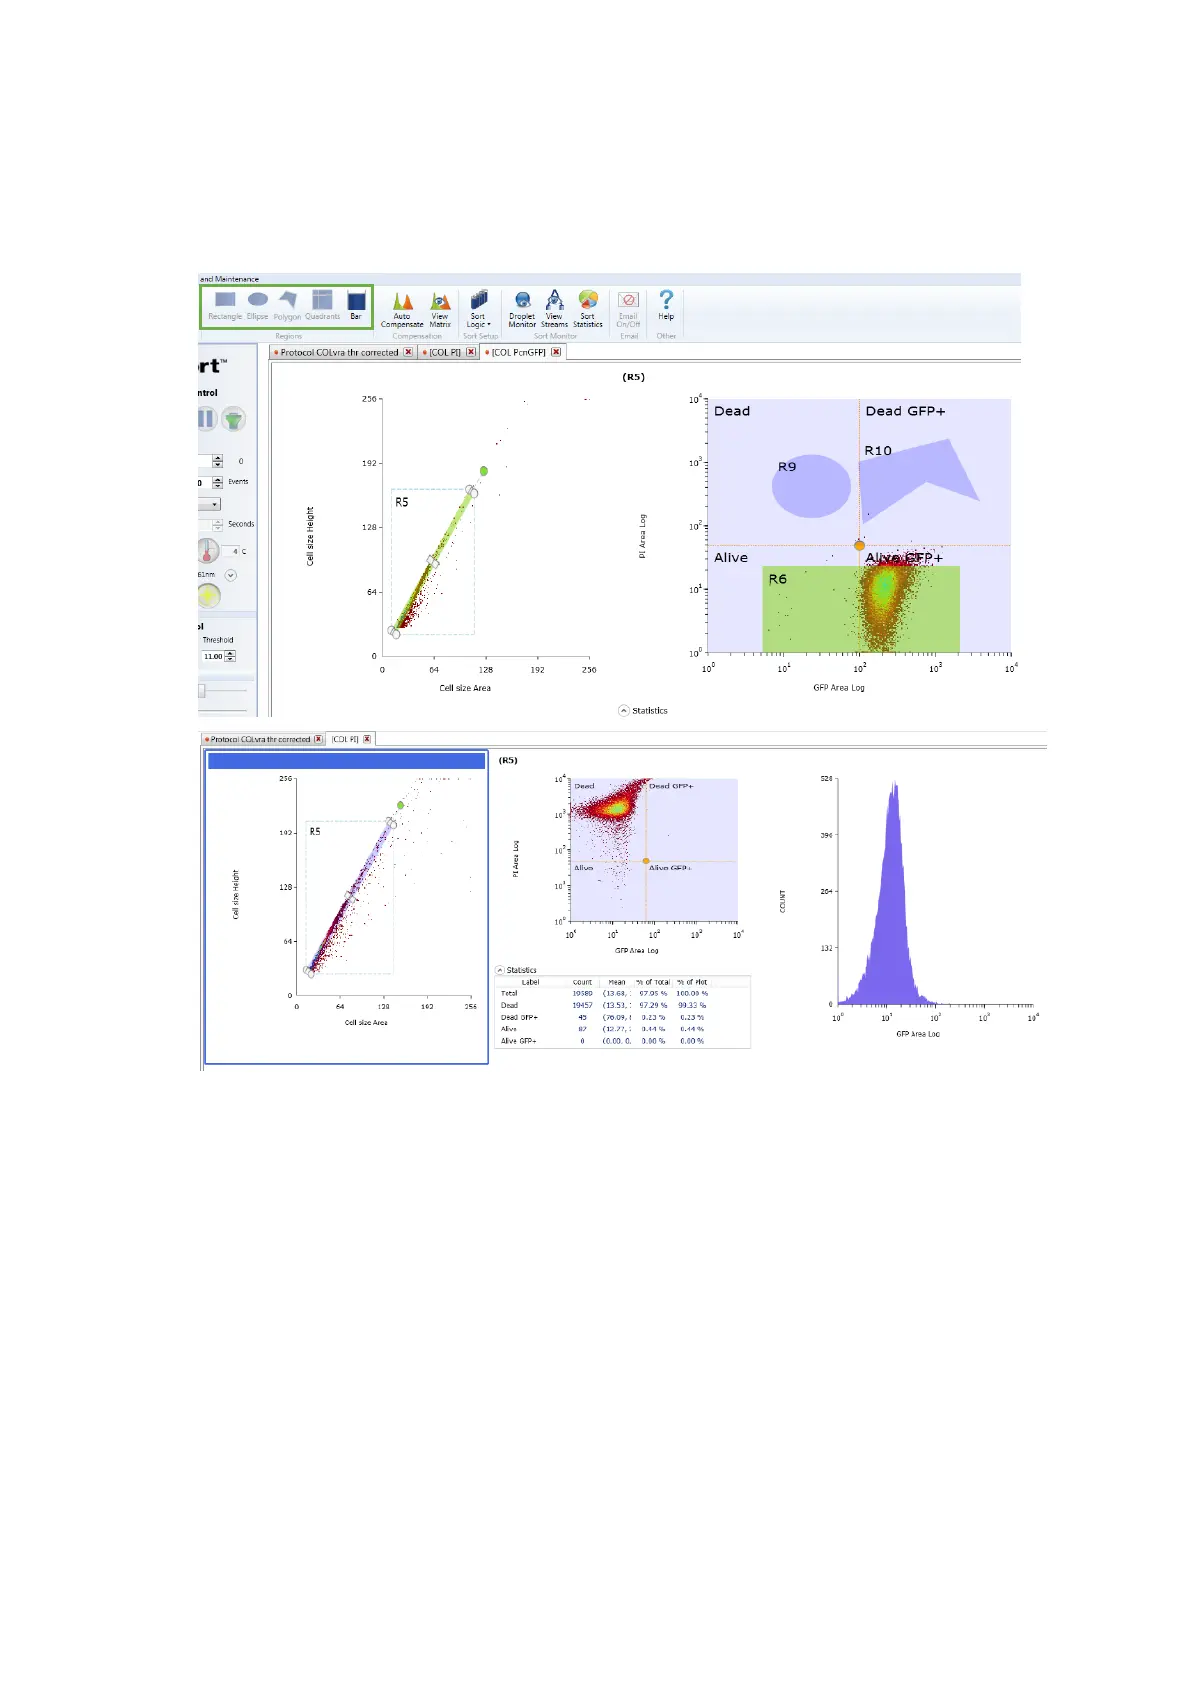
5. Set sorting regions and gates (in the Set Up and Maintenance tab) on plots with
the populations of interest
Hint: Create a signal intensity versus time dot plot. The signal intensity and time should
be displayed on the y and x axes, respectively. Then, select as many dots as possible
linearly disposed as if in a direct proportion. The dots contained in this region stand only
for single events. Use, therefore, this region of single events to fine sorting the sample.
Notice that, single events can also be fine-tuned using a FSC height versus FSC area dot
plot.