Bio-Well Company
www.bio-well.com
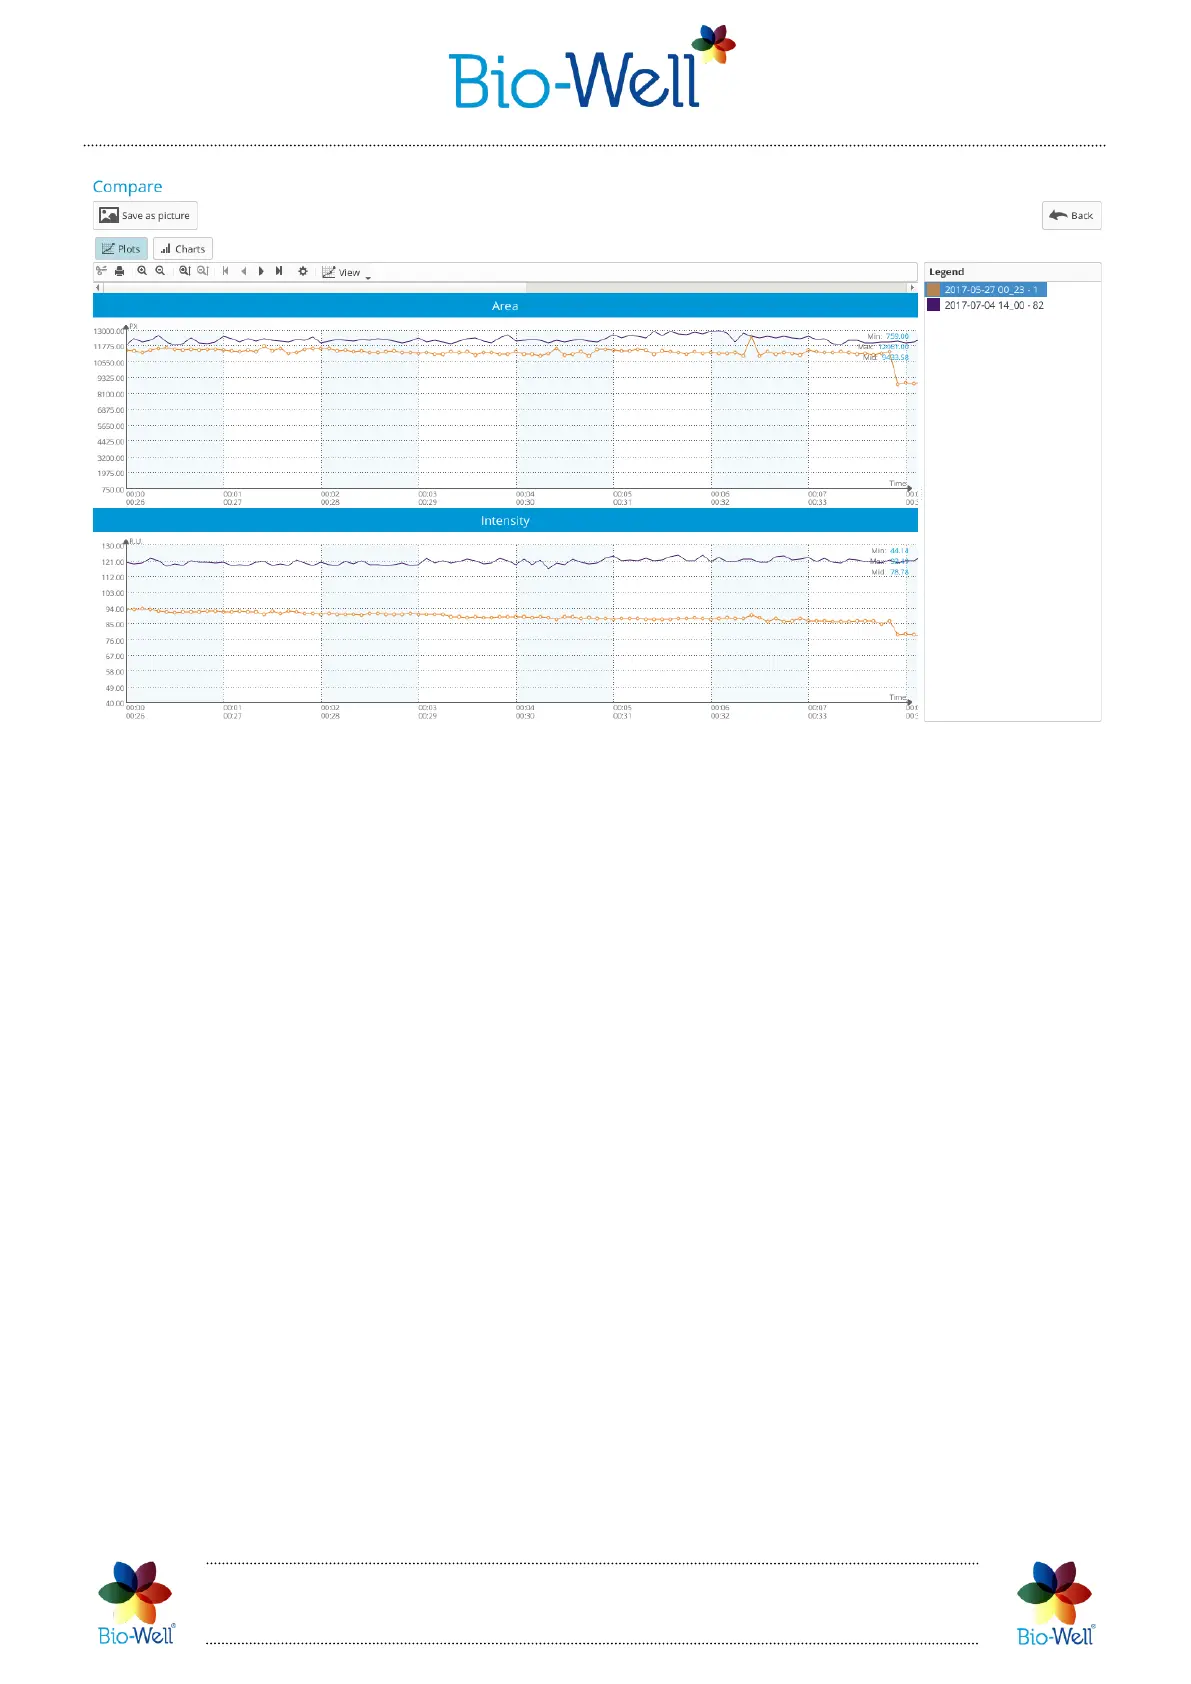
Pic. 83. Comparing “Environment” Scans: Plots view.
Here you can click “Save as picture” button in order to save the plots. Each scan
has an assigned color that you can see in the right column. You can use top bar with
standard features that were described earlier in this manual.
In the Charts view you will see Maximum, Minimum and Average values for: Area,
Intensity, Energy and Entropy parameters (pic. 84).
These values are calculated from the whole time of the experiment. Labels are not
taken into consideration during comparison of “Environment” Scans.
To return back to the list of Scans selected for comparison click “Back” button.
 Loading...