5-12
Pressing (SEL) while one of the function’s is highlighted would causes its “
R
” or “
B
”
indicator to be cleared. A function without an indicator is drawn as the main screen graph
(on the left side of the display).
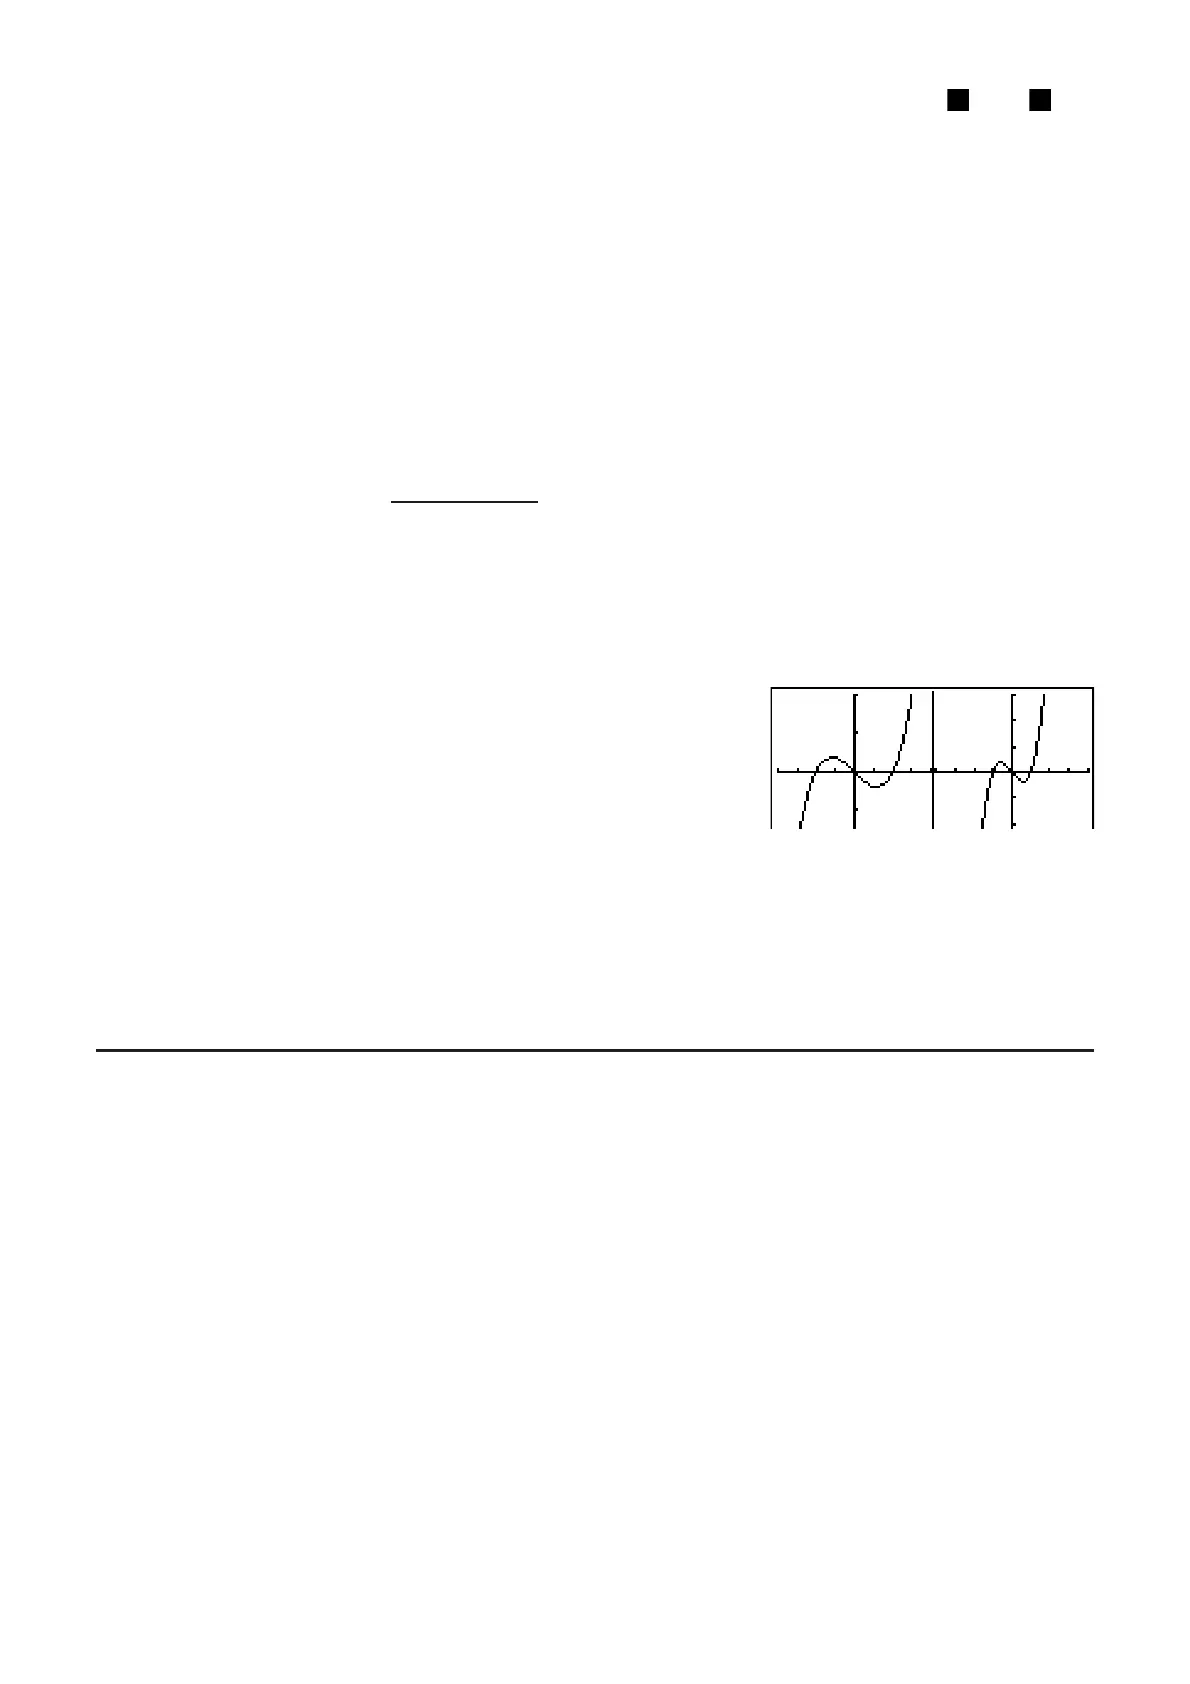
Example Graph
y = x(x + 1)(x – 1) in the main screen and sub-screen.
Use the following V-Window settings.
(Main Screen) Xmin = –2, Xmax = 2, Xscale = 0.5
Ymin = –2, Ymax = 2, Yscale = 1
(Sub-screen) Xmin = –4, Xmax = 4, Xscale = 1
Ymin = –3, Ymax = 3, Yscale = 1
K GRAPH
K(SET UP)_AAAA*(G+G))
*fx-7400G
ɉ, fx-9750Gɉ: AAA
(V-WIN) AUAU?DUA
AUAU@U
(RIGHT) CUCU@UA
BUBU@U)
(TYPE)(Y=)TT@
T@U
(DRAW)
*(COPY)
• Pressing while a graph is on the display will return to the screen in step 4.
6. Manual Graphing
I Rectangular Coordinate Graph
Inputting the Graph command in the RUN • MAT (or RUN) mode enables drawing of
rectangular coordinate graphs.
1. From the Main Menu, enter the RUN• MAT (or RUN) mode.
2. Make V-Window settings.
3. Input the commands for drawing the rectangular coordinate graph.
4. Input the function.
Example Graph
y = 2x
2
+ 3x – 4.
Use the following V-Window settings.
Xmin = –5, Xmax = 5, Xscale = 2
Ymin = –10, Ymax = 10, Yscale = 5
K RUN
•
MAT (or RUN)

 Loading...


