6-10
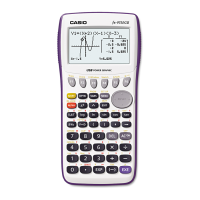
Example Input the two sets of data shown below and plot the data on a scatter
diagram. Next, perform logarithmic regression on the data to display the
regression parameters, and then draw the corresponding regression
graph.
0.5, 1.2, 2.4, 4.0, 5.2 (xList)
–2.1, 0.3, 1.5, 2.0, 2.4 (
yList)
K STAT
?DU@AUACUCUDAUC
A@U?BU@DUAUACU
(GRPH)(SET)A(Scat))(GPH1)
(CALC)(E)(Log)
(DRAW)
• You can perform trace on a regression graph. You cannot perform trace scroll.
• Input a positive integer for frequency data. Other types of values (decimals, etc.) cause an
error.
I Selecting the Regression Type
After you graph paired-variable statistical data, you can use the function menu at the bottom of
the display to select from a variety of different types of regression.
•{
ax+b}/{a+bx}/{Med}/{X^2}/{X^3}/{X^4}/{Log}/{ae^bx}/{ab^x}/{Pwr}/{Sin}/{Lgst} ...
{linear regression (ax+b form)}/{linear regression (a+bx form)}/{Med-Med}/{quadratic
regression}/{cubic regression}/{quartic regression}/{logarithmic regression}/{exponential
regression (ae
bx
form)}/{exponential regression (ab
x
form)}/{power regression}/
{sinusoidal regression}/{logistic regression} calculation and graphing
•{2VAR}... {paired-variable statistical results}
I Displaying Regression Calculation Results
Whenever you perform a regression calculation, the regression formula parameter (such as a
and b in the linear regression y = ax + b) calculation results appear on the display. You can use
these to obtain statistical calculation results.
Regression parameters are calculated as soon as you press a function key to select a
regression type, while a graph is on the display.
The following parameters are used by linear regression, logarithmic regression, exponential
regression, and power regression.
r..............correlation coefficient
r
2
.............coefficient of determination
MSe.........mean square error

 Loading...